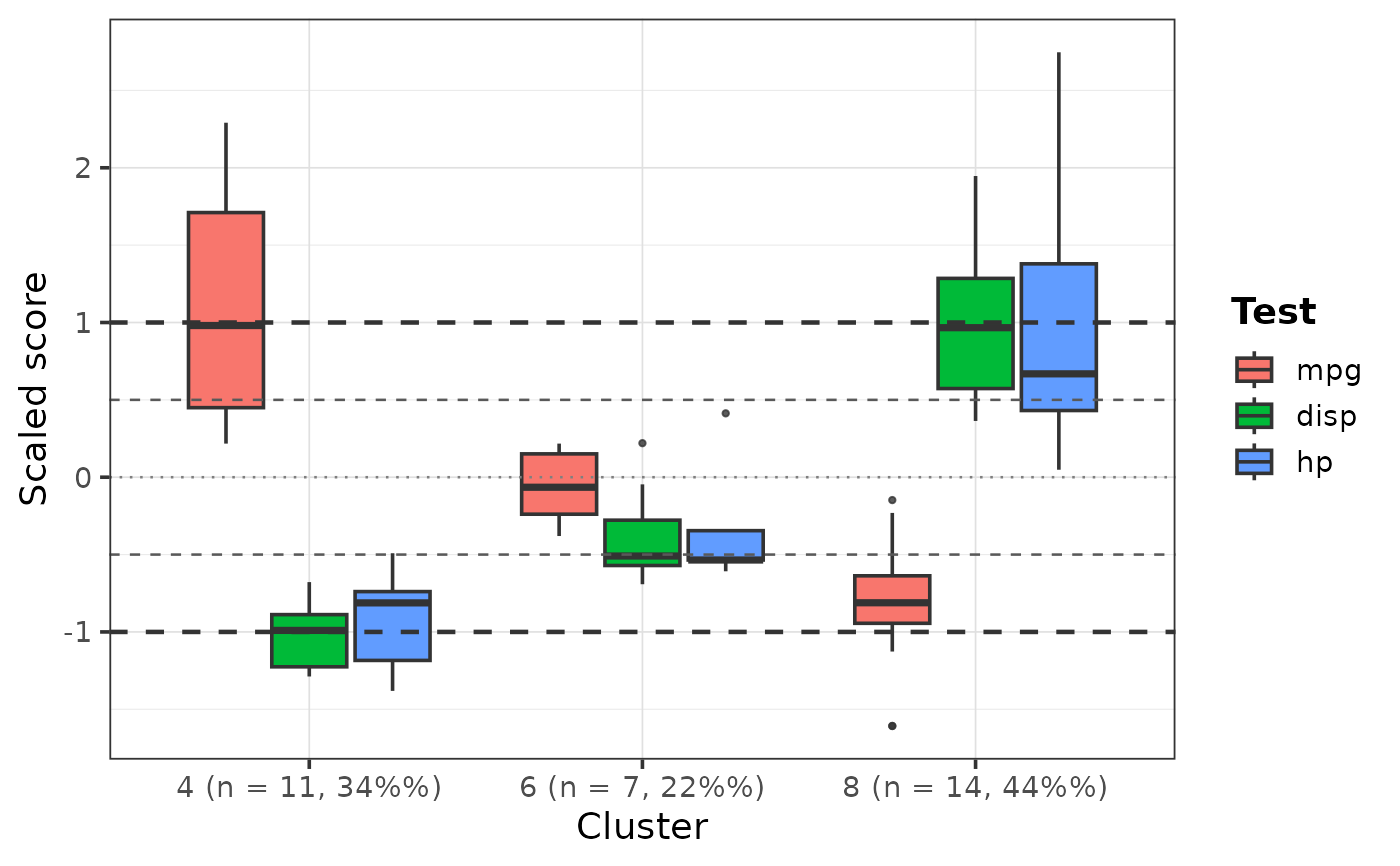
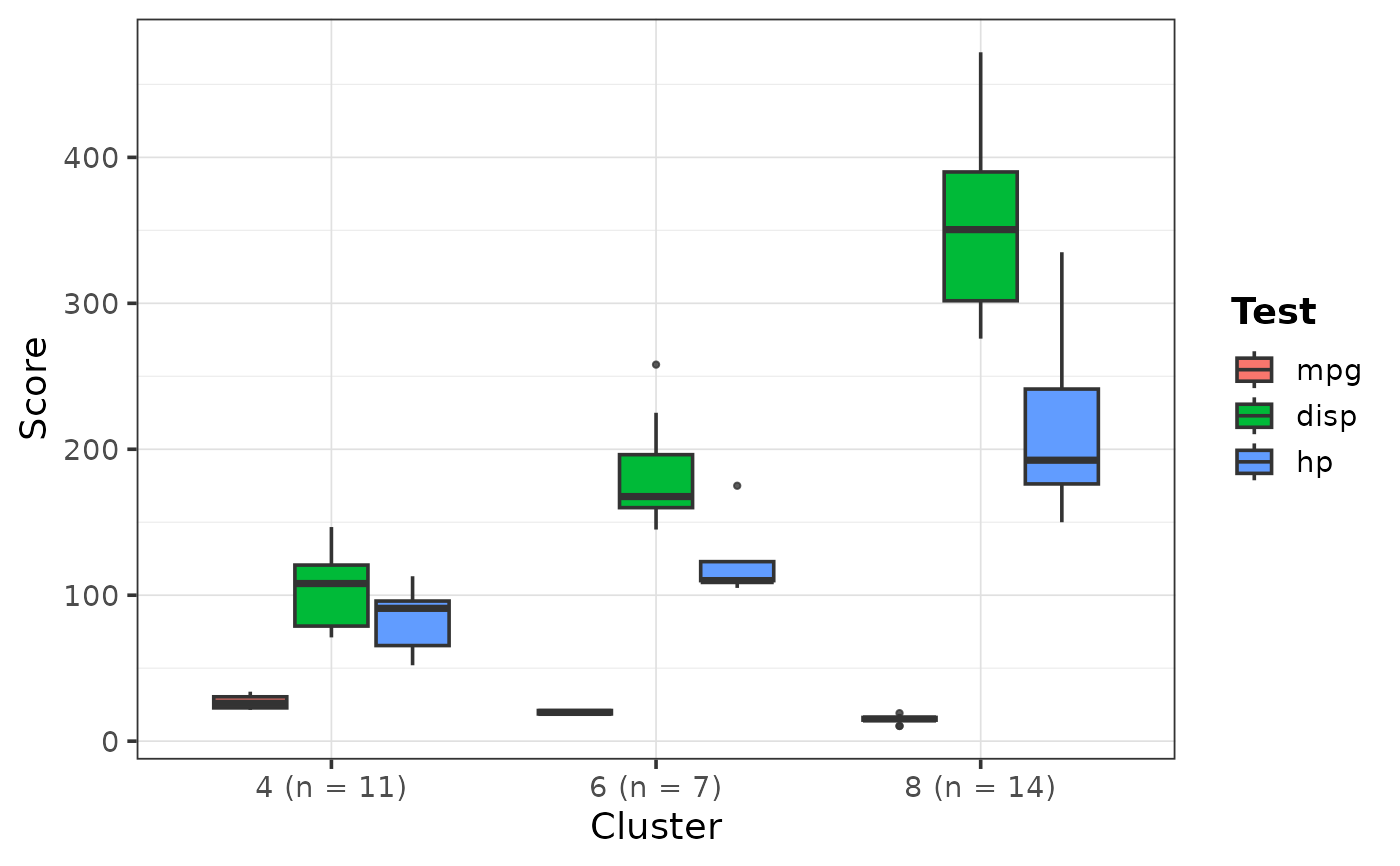
Create grouped cluster boxplots where clusters are shown on the x-axis and selected variables are shown as filled boxplots within each cluster. This is useful for visualizing cognitive, clinical, biomarker, or domain profiles across discovered clusters or subgroup solutions.
Usage
PlotClusterBoxplot(
  Data,
  ClusterVar,
  Variables,
  Codebook = NULL,
  Scale = FALSE,
  ScoreType = c("auto", "z", "t", "raw"),
  ReferenceLines = c("auto", "z", "t", "none"),
  ClusterLabel = c("n_percent", "n", "none"),
  Relabel = TRUE,
  FillTitle = "Test",
  YLabel = NULL,
  BoxplotWidth = 0.75,
  OutlierSize = 0.8,
  BaseSize = 14
)
Arguments
- Data
A data frame.
- ClusterVar
Character string naming the cluster/grouping variable.
- Variables
Character vector of variable names to plot.
- Codebook
Optional codebook data frame with columns
VariableandLabel.- Scale
Logical. If
TRUE, variables are z-scored across all participants before plotting. Default isFALSE.- ScoreType
Character. One of
"auto","z","t", or"raw". Used for axis labeling and reference-line defaults.- ReferenceLines
Character. One of
"auto","z","t", or"none".If
"z", lines are added at-1,-0.5,0,0.5, and1.If
"t", lines are added at40,45,50,55, and60.If
"none", no reference lines are added so users can customize overlays manually using additional ggplot layers.- ClusterLabel
Character. One of
"n_percent","n", or"none"."n_percent"adds cluster sample size and percent to the x-axis label."n"adds only sample size."none"uses only the cluster name/value.- Relabel
Logical. If
TRUE, variable labels are used when available. Labels are pulled first fromCodebook, then from variable label attributes. Default isTRUE.- FillTitle
Character string used as the fill legend title. Default is
"Test".- YLabel
Optional y-axis label. If
NULL, an appropriate label is chosen automatically fromScaleandScoreType.- BoxplotWidth
Numeric width passed to
ggplot2::geom_boxplot(). Default is0.75.- OutlierSize
Numeric size of outlier points. Default is
0.8.- BaseSize
Base font size for the plot theme. Default is
14.
Details
Variables can optionally be z-scored across all participants before plotting. Reference lines can be automatically added for z-score or T-score style interpretation, or omitted entirely for custom overlays.
Variable labels are used by default when available from a codebook or from variable label attributes.