Plot Single Interaction Effect
Source:R/PlotInteractionEffectsContinuous.R
PlotInteractionEffectsContinuous.RdCreates a scatter plot with regression lines showing the interaction between a predictor and outcome variable, moderated by either a continuous or categorical variable.
Usage
PlotInteractionEffectsContinuous(
  data,
  interVar = NULL,
  outcome_var = NULL,
  predictor_var = NULL,
  covariates = NULL,
  n_lines = 3,
  alpha = 0.6,
  point_size = 2,
  Data = lifecycle::deprecated(),
  outcomeVar = lifecycle::deprecated(),
  predictorVar = lifecycle::deprecated(),
  covars = lifecycle::deprecated()
)
Arguments
- data
A data frame containing the variables to be analyzed
- interVar
Character string specifying the interaction variable (moderator)
- outcome_var
Character string specifying the outcome variable
- predictor_var
Character string specifying the predictor variable
- covariates
Character vector of covariate names to include in the model
- n_lines
For continuous moderators, number of lines to plot (default: 3 for low/med/high)
- alpha
Transparency level for points (default: 0.6)
- point_size
Size of points (default: 2)
- Data
Deprecated (since 19.15.0). Use
datainstead.- outcomeVar
Deprecated (since 19.15.0). Use
outcome_varinstead.- predictorVar
Deprecated (since 19.15.0). Use
predictor_varinstead.- covars
Deprecated (since 19.15.0). Use
covariatesinstead.
Details
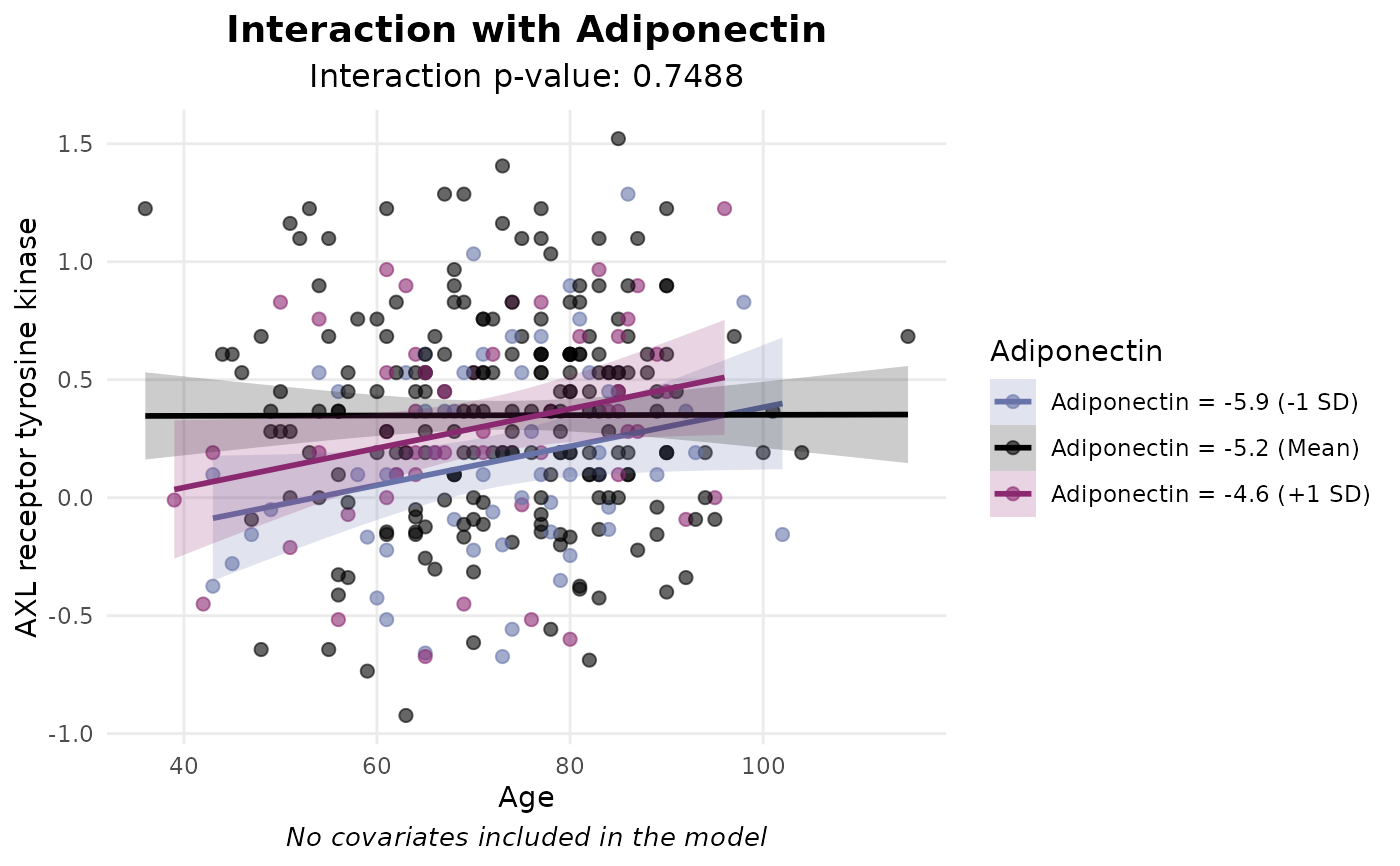
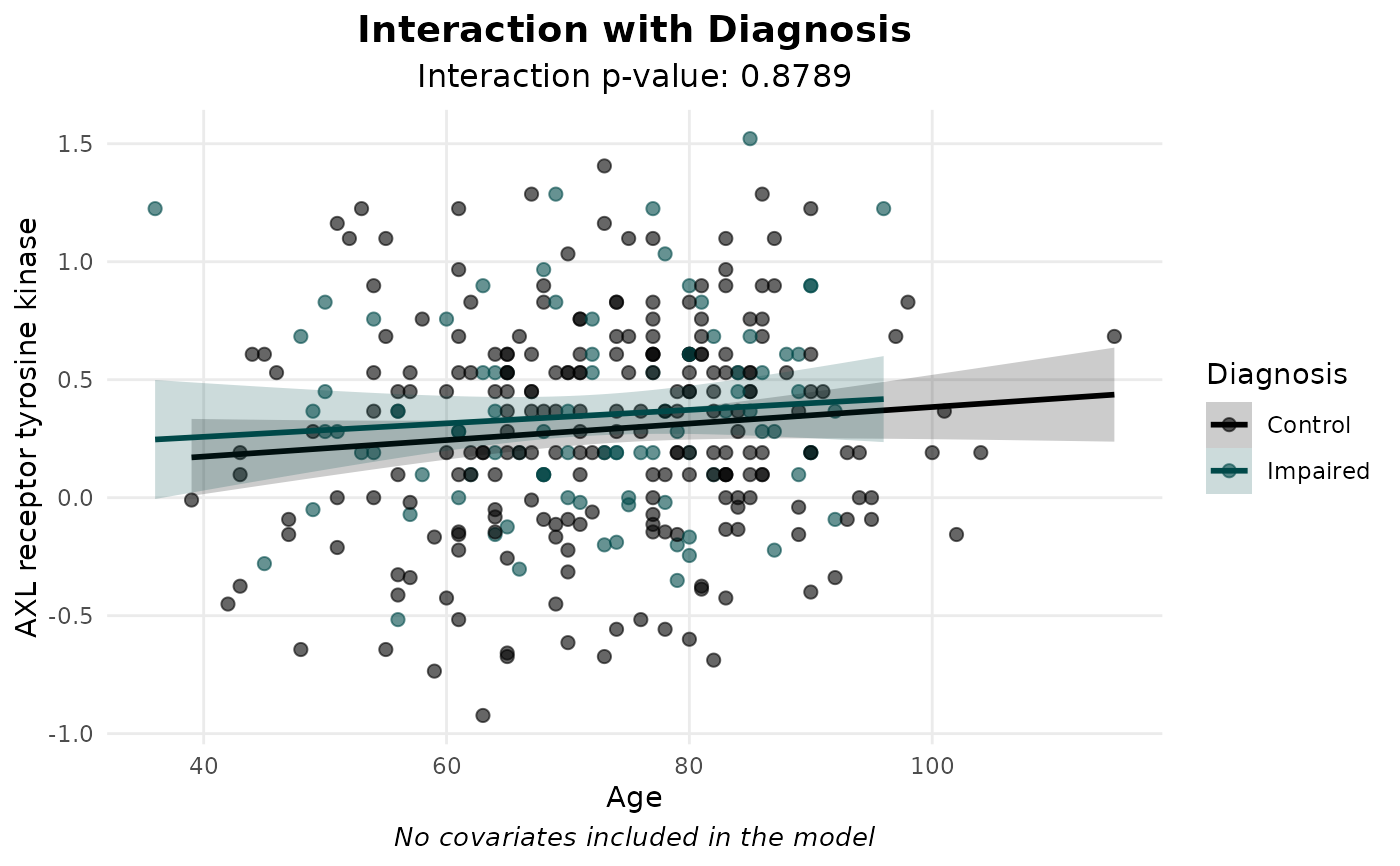
For categorical moderators, separate regression lines are plotted for each category. For continuous moderators, regression lines are plotted at the mean and +/- 1 SD.
The subtitle shows the p-value for the interaction term. The caption lists any covariates included in the model.
Variable labels are used if available in the data frame.
Examples
data(SampleData)
data(SampleVariableTypes)

# Attach labels and factor levels for readable axis titles and legend
Labelled <- RevalueData(SampleData, SampleVariableTypes)$RevaluedData

# Categorical moderator: one regression line per Diagnosis group
PlotInteractionEffectsContinuous(
  Labelled,
  interVar = "Diagnosis",
  outcome_var = "AXL",
  predictor_var = "age"
)
#> `geom_smooth()` using formula = 'y ~ x'


# Continuous moderator: lines at mean and +/- 1 SD of the moderator
PlotInteractionEffectsContinuous(
  Labelled,
  interVar = "Adiponectin",
  outcome_var = "AXL",
  predictor_var = "age"
)
#> `geom_smooth()` using formula = 'y ~ x'
# Continuous moderator: lines at mean and +/- 1 SD of the moderator
PlotInteractionEffectsContinuous(
Labelled,
interVar = "Adiponectin",
outcome_var = "AXL",
predictor_var = "age"
)
#> `geom_smooth()` using formula = 'y ~ x'