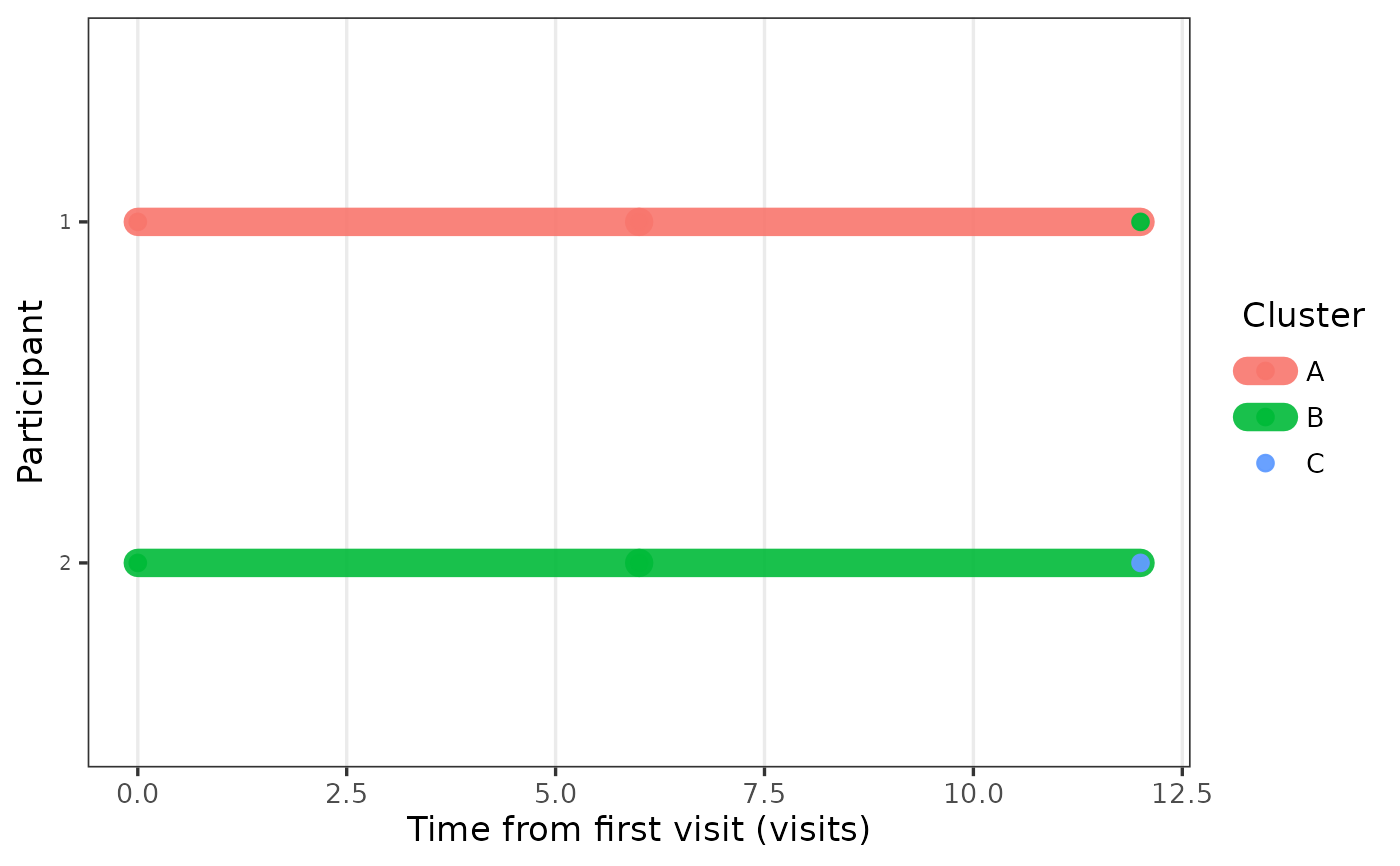
Create swimmer-style longitudinal timeline plots from long-format visit data. Each row in the input data represents a subject visit or observation. The function can visualize longitudinal state trajectories, visit timing, and events over time.
Usage
PlotTimeSwimmer(
  Data,
  ID,
  Time,
  State = NULL,
  Event = NULL,
  EventType = NULL,
  TimeScale = c("from_first", "observed", "from_event"),
  EventReference = NULL,
  StateInterval = c("forward", "point"),
  Format = c("state_path", "visit_points", "event_rug", "minimal"),
  SortBy = c("duration", "last_time", "first_time", "state", "id"),
  TimeUnit = c("auto", "days", "weeks", "months", "years", "visits"),
  Relabel = TRUE,
  Codebook = NULL,
  LineWidth = 5,
  PointSize = 2.5,
  Alpha = 0.9,
  BaseSize = 13
)
Arguments
- Data
A data frame in long format with one row per visit or observation.
- ID
Character string naming the participant ID column.
- Time
Character string naming the time variable.
- State
Optional character string naming a state/group variable used for coloring timelines or visit points.
- Event
Optional character string naming a logical or binary event indicator variable.
- EventType
Optional character string naming an event category variable. Used for event point shapes/colors.
- TimeScale
Character. One of
"from_first","observed", or"from_event"."observed"uses raw observed time values."from_first"normalizes each subject relative to their first observed timepoint."from_event"normalizes each subject relative to the first occurrence ofEventReference.- EventReference
Optional event value used when
TimeScale = "from_event".- StateInterval
Character. One of
"forward"or"point"."forward"extends the current state forward until the next visit."point"only colors visit points without extending intervals.- Format
Character. One of
"state_path","visit_points","event_rug", or"minimal".- SortBy
Character. One of
"duration","last_time","first_time","state", or"id".- TimeUnit
Character. One of
"auto","days","weeks","months","years", or"visits".- Relabel
Logical. If
TRUE, use labels fromCodebookor variable attributes when available.- Codebook
Optional codebook data frame with columns
VariableandLabel.- LineWidth
Numeric line width for swimmer segments. Default is
5.- PointSize
Numeric point size for visit/event points. Default is
2.5.- Alpha
Numeric alpha transparency for swimmer segments. Default is
0.9.- BaseSize
Base font size for the plot theme. Default is
13.
Details
Time can be represented using dates or numeric visit values. Timelines can optionally be normalized relative to each participant's first visit or the first occurrence of a specified event.
States can either be displayed as continuous intervals extending forward
until the next visit (StateInterval = "forward") or shown only as visit
points (StateInterval = "point").