
Create facet labels for ggplot2 based on variable labels in a data frame
Source:R/CreateFacetLabels.R
createFacetLabels.RdThis function takes a data frame containing variable labels and creates facet labels suitable for use with ggplot2 facet functions.
Usage
createFacetLabels(data, DataFrame = lifecycle::deprecated())Details
Faceted plots label their strips with the column name, which in study data
is usually the least readable thing available: p_tau, ACE_CD143,
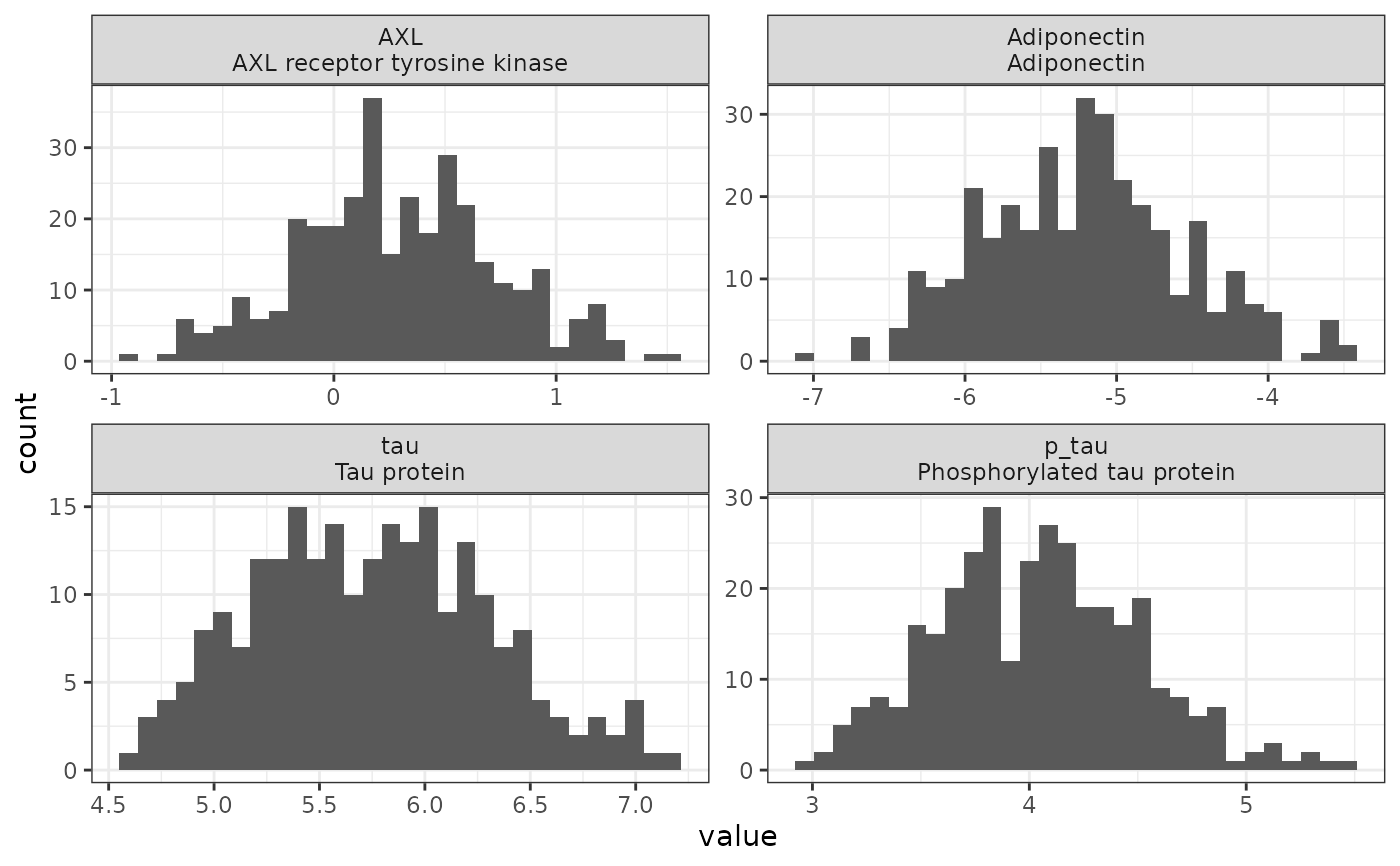
Weight_kg_v2. This builds strip labels that carry the column name and
the variable label attached by RevalueData(), one per line, so a reader
can see what a panel measures without also losing the name needed to find
that column again.
The returned vector is in column order, which is what makes it usable
directly as the labels argument of factor() when reshaping to long
format for faceting.
Variables with no attached label fall back to their name, so the vector is always the right length and mixed labelled/unlabelled frames are safe.
See also
RevalueData(), which attaches the labels this reads, and
PlotContinuousDistributions(), which applies the same idea internally
through its FacetLabelStyle argument.
Examples
data(SampleData)
data(SampleVariableTypes)
Labelled <- RevalueData(SampleData, SampleVariableTypes)$RevaluedData
vars_Show <- c("AXL", "Adiponectin", "tau", "p_tau")
# Column name on the first line, attached label on the second
labels_Facet <- createFacetLabels(Labelled[vars_Show])
labels_Facet
#> [1] "AXL\nAXL receptor tyrosine kinase" "Adiponectin\nAdiponectin"
#> [3] "tau\nTau protein" "p_tau\nPhosphorylated tau protein"
# \donttest{
df_Long <- tidyr::pivot_longer(
dplyr::mutate(
Labelled[vars_Show],
dplyr::across(dplyr::everything(), as.numeric)
),
cols = dplyr::everything()
)
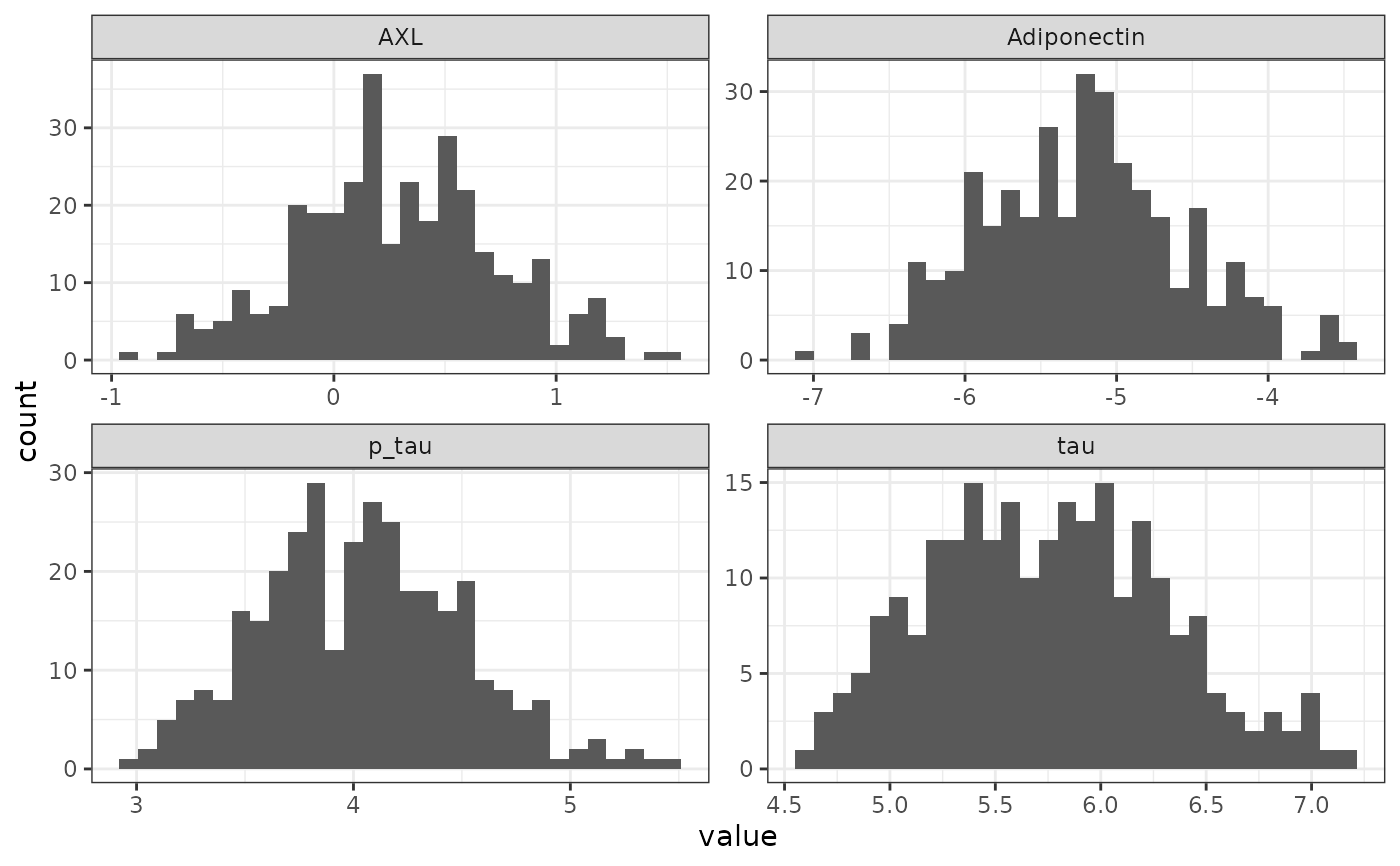
# Without the labels: strips carry bare column names
ggplot2::ggplot(df_Long, ggplot2::aes(x = value)) +
ggplot2::geom_histogram(bins = 30, na.rm = TRUE) +
ggplot2::facet_wrap(~ name, scales = "free") +
ggplot2::theme_bw()
 # With them: each panel says what it measures
df_Long$name <- factor(
df_Long$name,
levels = vars_Show,
labels = labels_Facet
)
ggplot2::ggplot(df_Long, ggplot2::aes(x = value)) +
ggplot2::geom_histogram(bins = 30, na.rm = TRUE) +
ggplot2::facet_wrap(~ name, scales = "free") +
ggplot2::theme_bw()
# With them: each panel says what it measures
df_Long$name <- factor(
df_Long$name,
levels = vars_Show,
labels = labels_Facet
)
ggplot2::ggplot(df_Long, ggplot2::aes(x = value)) +
ggplot2::geom_histogram(bins = 30, na.rm = TRUE) +
ggplot2::facet_wrap(~ name, scales = "free") +
ggplot2::theme_bw()
 # }
# }