
Fit a projectable Gaussian-mixture clustering model
Source:R/ClusteringPipelines.R
CreateClusterModel_MClust.RdBest for continuous measures when clinically meaningful groups may differ in means, variance, or covariance and posterior uncertainty is useful.
Usage
CreateClusterModel_MClust(
  data,
  variables = NULL,
  method = c("exploratory", "finalize"),
  k_range = 2:10,
  models = c(1L, 2L, 3L, 6L),
  final_k = NULL,
  final_model = NULL,
  ZScoreType = NULL,
  Scaling = NULL,
  ClusterVariableName = "Cluster",
  seed = 93421L,
  stability_resamples = 0L,
  stability_seed = seed + 1L,
  stability_progress = FALSE,
  stability_cores = NULL
)
Arguments
- data
Data frame containing numeric clustering variables.
- variables
Variables used for clustering.
- method
Either
"exploratory"or"finalize".- k_range
Candidate cluster counts in exploratory mode.
- models
Numeric tidyLPA mclust model IDs. The supported models are:
1(EEI), equal variance and zero covariance;2(VVI), varying variance and zero covariance;3(EEE), equal variance and equal covariance; and6(VVV), varying variance and varying covariance. Zero-covariance models assume conditional independence between variables within each cluster. Equal parameters are shared across clusters; varying parameters are estimated separately for each cluster. Models 4 and 5 require OpenMx and are not supported by these pipelines.- final_k, final_model
Finalized cluster count and numeric model ID.
- ZScoreType
Frozen numeric preprocessing.
Scalingis a compatibility alias.- Scaling
Compatibility alias for
ZScoreType.- ClusterVariableName
Output cluster column name.
- seed
Random seed retained for reproducibility.
- stability_resamples
Number of 90% participant subsample refits used to estimate candidate reproducibility. Subsamples are drawn without replacement. Use
0to disable stability analysis.- stability_seed
Seed controlling participant subsampling.
- stability_progress
Whether to print subsample progress messages.
- stability_cores
Number of workers for stability refits.
NULLuses a conservative CPU/memory cap: the smaller of 50% physical RAM and 75% of available RAM. Explicit values warn when their estimated memory exceeds this budget.
Value
A projectable mixture model. ModelInfo$fit_table contains BIC,
ICL, entropy, uncertainty, and subsample stability metrics. BIC and
ICL are reported on the scale mclust returns them on, where higher is
better; AIC is reported on the conventional scale, where lower is
better. Entropy is higher-is-better classification separation and maximum
uncertainty is lower-is-better. Shared stability fields are defined in the clustering
reference vignette.
ModelInfo$AHP the advisory recommendation. Figures sit beside what they
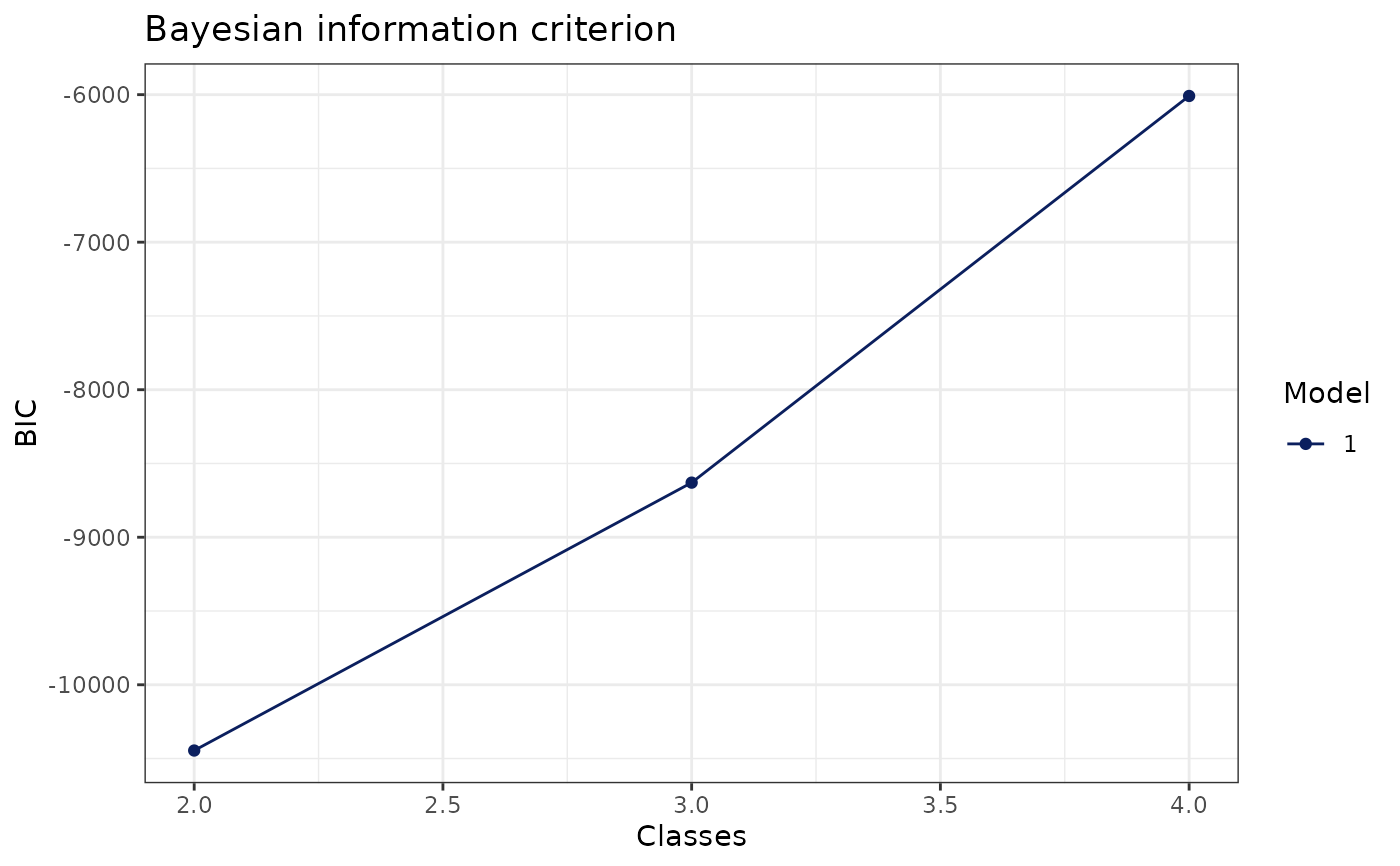
describe: fit_plot reviews candidates; ModelInfo$plots holds bic,
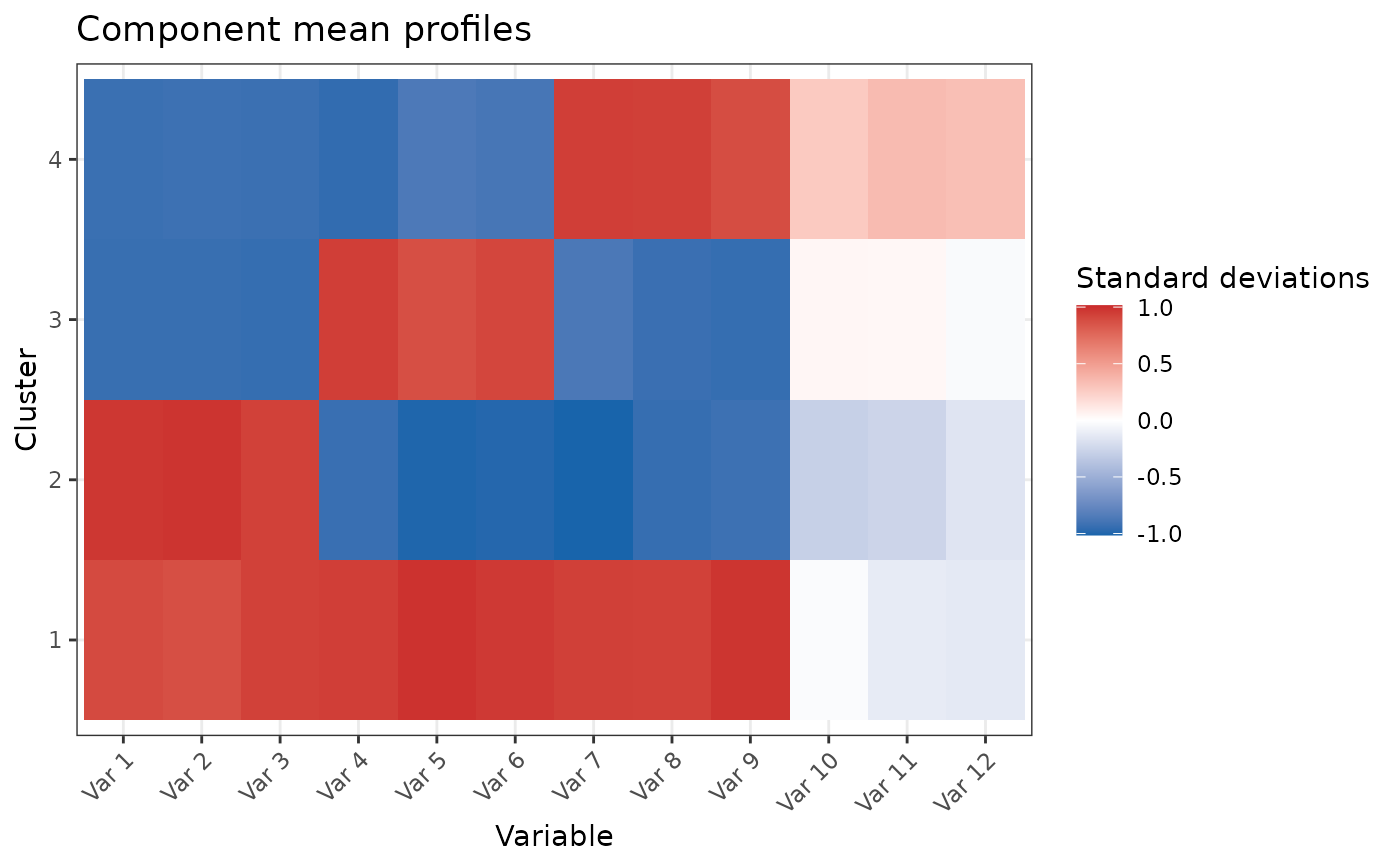
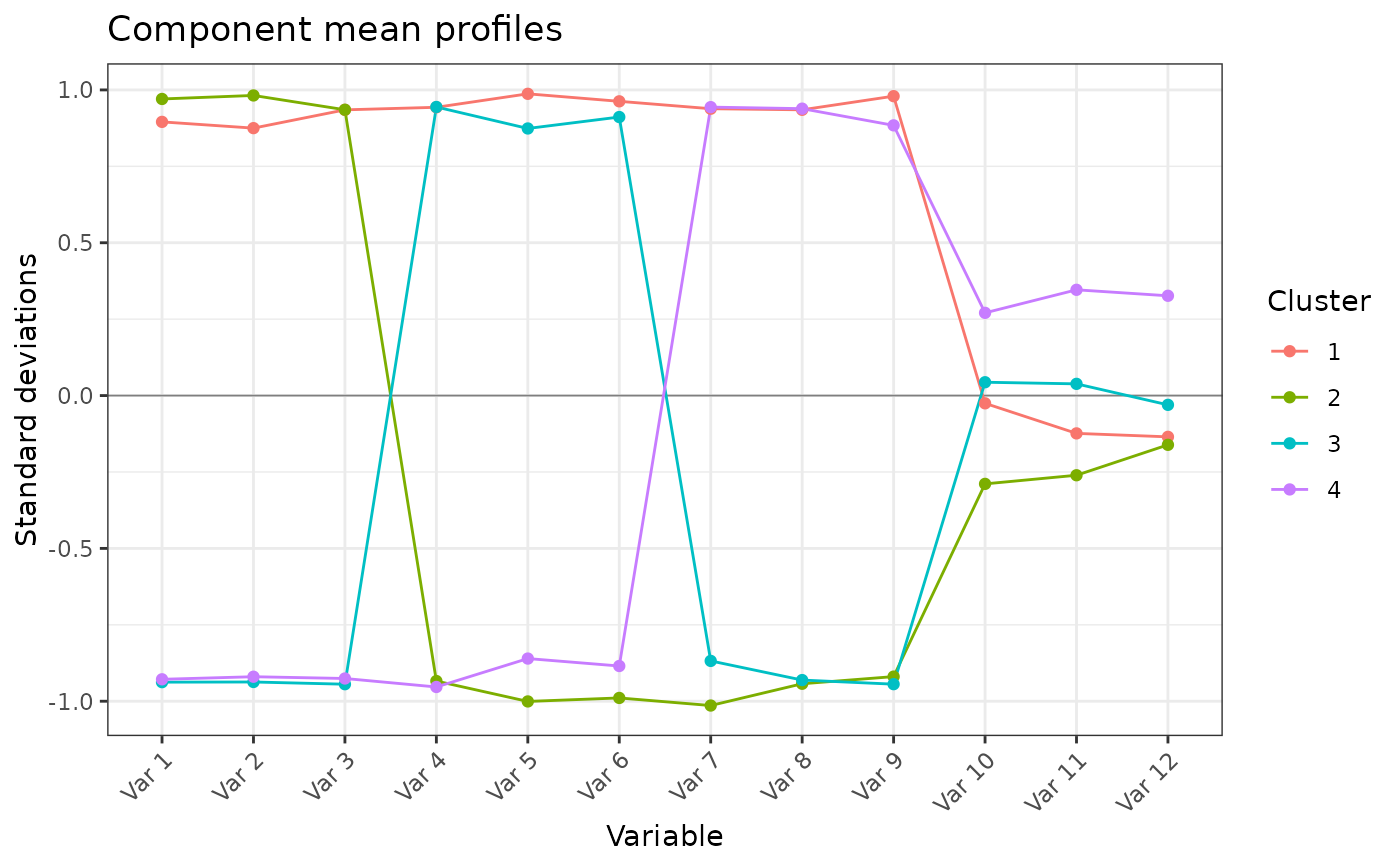
icl, entropy, centre_heatmap, centre_profile, and profiles;
ModelInfo$FitDiagnostics$plots holds the Mahalanobis distance
histogram;
ProbFit$plots holds posterior-confidence figures; and Stability$plots
holds cluster-recovery and complementary stability diagnostics.
Stability output
Stability assesses internal reproducibility by full-pipeline 90% participant
subsampling without replacement. For each replicate, 90% of complete
participants are selected once, all preprocessing, any reduction (PCA,
MCA, or SOM), and the selected clustering method are refit. Most pipelines
compare assignments for sampled participants. SOM + Mclust instead maps the
complete reference cohort onto every refit and compares the resulting full
participant partition. Stability$settings$comparison_scope records the
policy used. It is an internal sensitivity analysis, not
independent-cohort validation.
Stability$settings records the analysis provenance:
resamples: requested number of 90% subsample refits.seed: seed used to derive reproducible sampling and model seeds.refit_scope: whether agreement is calculated directly in the refitted sample or after refit projection onto the reference cohort.comparison_scope: the participants entering replicate agreement metrics; most pipelines use"sampled_participants", while SOM + Mclust uses"all_reference_participants".resample_type:"subsample_without_replacement"for the primary stability analysis.resample_fraction: the retained participant fraction,0.90.resample_fractions: every requested retention fraction. The default is0.90; additional values create an opt-in deletion-stability curve without replacing the 90% primary screen.coassignment_limit: maximum number of complete training participants (2,000) for which the full pairwise co-assignment matrix is calculated.noise_policy: whether the method has noise labels. For ordinary methods it is"all clusters included"; HDBSCAN variants retain noise in ARI but exclude it from phenotype-level Jaccard recovery.requested_cores,resolved_cores, andworker_policy: the requested and resolved refit workers and the reason for the resolution. Automatic resolution is capped by CPU, refit count, and the smaller of 50% physical RAM and 75% currently available RAM. Pairwise-memory methods are run serially automatically.estimated_bytes_per_worker,estimated_total_bytes,physical_memory_bytes,available_memory_bytes, andsafe_memory_budget_bytes: the conservative memory audit used to resolve automatic workers. An explicit worker request is preserved (within the CPU/scheduler cap) but warns if it exceeds the estimated safe budget.
Stability$replicates has one row per requested refit. Model and
Classes identify the selected candidate (for HDBSCAN, Classes is the
data-derived extracted count); Replicate is its sequence number; Status
is "success" or a failure status; SamplingSeed and ModelSeed identify
the participant draw and refit initialization policy; and Error
contains the error message for an unsuccessful refit. ARI is the primary
successful-refit metric: it is invariant to cluster numbering, higher is
better, and it can be negative when agreement is worse than chance.
Stability$cluster_recovery has one row for each reference Cluster in
each successful Replicate. Jaccard is the recovery of that reference
cluster after matching it to the subsample cluster with the largest Jaccard
overlap; higher is better and one is exact recovery. Model and Classes
again identify the fitted candidate.
Stability$summary combines successful subsample refits:
StabilitySuccessRate is successful refits divided by requested refits, an
operational reliability measure that does not enter the reproducibility
score. StabilityARI_Mean and StabilityARI_P05 are the mean and fifth
percentile of ARI. StabilityJaccard_Mean and StabilityJaccard_Min are
respectively the mean cluster-level recovery and the minimum of the
cluster-specific mean recoveries across replicates.
ReproducibilityScore does not include success rate. For most pipelines it
is the mean of finite StabilityARI_Mean and StabilityJaccard_Mean
values; SOM + Mclust uses StabilityARI_Mean directly because it selects
on agreement of the final participant partition.
SOM + Mclust additionally returns StabilityARI_NonBoundary,
StabilityARI_NonBoundary_P05, and non-boundary Jaccard summaries. These
are secondary diagnostics calculated only on the fixed reference-model mask
with SoftMargin below its threshold or SoftEntropy above its threshold
excluded. The primary all-participant ARI always retains these boundary
participants. boundary_summary reports their count and proportion overall
and within each reference cluster. Earlier posterior-based Core fields are
retained for compatibility as descriptive diagnostics; they are not the
boundary-aware sensitivity measure.
Stability$failures repeats the replicate columns for unsuccessful refits,
making fit failures auditable without mixing them with successful metrics.
Stability$participant_inclusion is one row per complete reference
participant. .row_id identifies the merge-safe input row, Cluster its
reference assignment, SuccessfulRefits the number of usable refits, and
InclusionProbability the proportion of those refits in which the
participant returned to that cluster's label-matched subsample cluster.
Model and Classes identify the candidate. Higher inclusion is better.
Stability$cluster_inclusion summarizes inclusion within each reference
Cluster: MeanInclusion, P05Inclusion, and MinInclusion are the mean,
fifth percentile, and minimum participant inclusion probabilities; Model
and Classes identify the candidate. Higher values indicate that all, not
only the average, of a cluster is recovered consistently.
Stability$coassignment is available only when the complete training cohort
has at most coassignment_limit participants. Each candidate entry has a
status of "available", "skipped", or "not_available"; reason
explains a non-available result; matrix is the pairwise probability that
two complete reference participants are assigned together across successful
subsample refits; and .row_id maps matrix rows and columns to the same
identifiers returned in DataWithClusters and ProbFit$individual. Higher
matrix values mean more consistent pairwise co-membership.
Where more than one candidate is summarized, entries are named by its
Model_Classes key. The matrix is diagnostic only and is never used for
selection.
SOM + Mclust additionally returns memory-safe final-partition diagnostics
for every cohort size. co_membership_by_cluster reports the proportion of
within-reference-cluster participant pairs retained together (Cohesion) and
the probability of co-assignment with outsiders (CrossMixing).
co_membership_between_clusters reports cross-reference-cluster
co-assignment probabilities. split_merge_reference and
split_merge_refit identify dominant sources, shares, and effective numbers
of groups, while profile_recovery reports matched-cluster correlation and
RMSE for mean clustering-variable profiles on the frozen reference scale.
These explain the nature of membership changes; they do not supersede ARI.
deletion_curve summarizes ARI, VI, NMI, and Fowlkes–Mallows agreement at
each requested participant-retention fraction. It is useful for describing
sensitivity to increasing cohort perturbation, not for selecting the least
demanding fraction.
Stability$plots contains cluster_recovery (per-cluster Jaccard),
partition_metrics (the ARI distribution), and
cluster_inclusion; it also contains a co-assignment heatmap when the
matrix is available. These diagnostics complement rather than replace ARI
and Jaccard: none can turn a poorly reproducible cluster into a stable
phenotype.
Metric sources: Hubert and Arabie (1985) define ARI; Jaccard (1901) defines the overlap coefficient; and Monti et al. (2003) describe resampling-based consensus co-assignment.
References
Scrucca L, Fop M, Murphy TB, Raftery AE. mclust 5: Clustering, classification and density estimation using Gaussian finite mixture models. J Stat Softw. 2016;8(1):1-29.
Examples
# \donttest{
data("SimulatedPhenotypeData")
df_Training <- dplyr::filter(SimulatedPhenotypeData, .data$Cohort == "Training")
df_Projection <- dplyr::filter(SimulatedPhenotypeData, .data$Cohort == "Projection")
vars_Numeric <- paste0("Var", 1:12)
review <- CreateClusterModel_MClust(
df_Training, vars_Numeric, k_range = 2:4, models = 1,
stability_resamples = 2
)
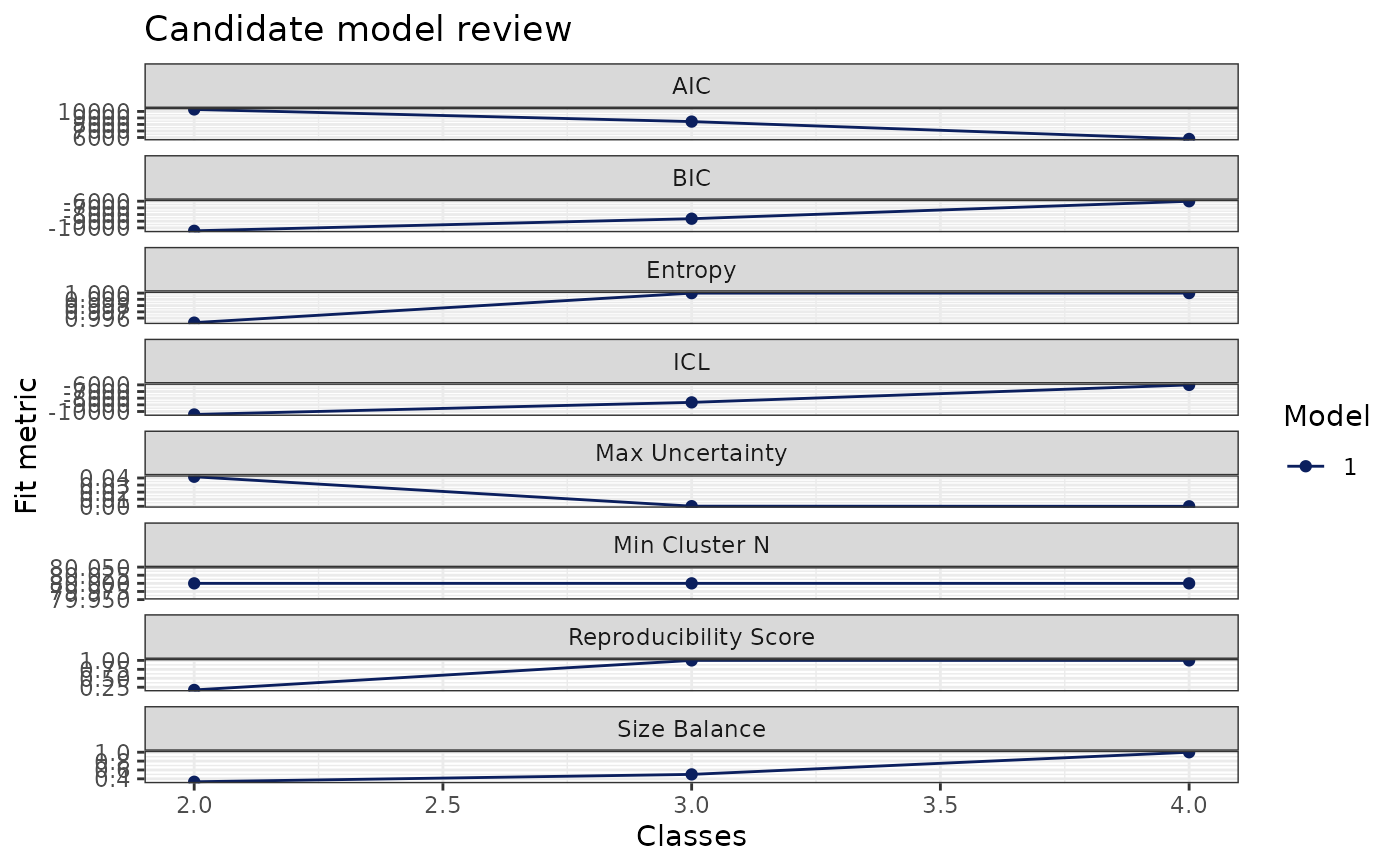
review$ModelInfo$fit_table
#> # A tibble: 3 × 28
#> Model ModelName ModelLabel Classes BIC ICL AIC Entropy MinClusterN
#> <int> <chr> <chr> <int> <dbl> <dbl> <dbl> <dbl> <int>
#> 1 1 EEI Model 1: e… 4 -6009. -6009. 5771. 1.000 80
#> 2 1 EEI Model 1: e… 3 -8630. -8630. 8441. 1.000 80
#> 3 1 EEI Model 1: e… 2 -10446. -10446. 10306. 0.995 80
#> # ℹ 19 more variables: SizeBalance <dbl>, MaxUncertainty <dbl>,
#> # StabilitySuccessRate <dbl>, StabilityARI_Mean <dbl>,
#> # StabilityARI_P05 <dbl>, StabilityJaccard_Mean <dbl>,
#> # StabilityJaccard_Min <dbl>, NoiseSensitivity <dbl>, NoiseSpecificity <dbl>,
#> # ReproducibilityScore <dbl>, BIC_scaled <dbl>, ICL_scaled <dbl>,
#> # Entropy_scaled <dbl>, MinClusterN_scaled <dbl>, SizeBalance_scaled <dbl>,
#> # ReproducibilityScore_scaled <dbl>, MaxUncertainty_scaled <dbl>, …
review$ModelInfo$AHP$recommendation
#> [1] "AHP-style review recommends Gaussian-mixture model (Model = 1, Classes = 4). Review this advisory choice alongside the candidate plots."
review$fit_plot
 review$ModelInfo$plots$bic
 model <- CreateClusterModel_MClust(
df_Training, vars_Numeric, method = "finalize", final_k = 4,
final_model = 1, stability_resamples = 2
)
model$ModelInfo$plots$centre_heatmap
model <- CreateClusterModel_MClust(
df_Training, vars_Numeric, method = "finalize", final_k = 4,
final_model = 1, stability_resamples = 2
)
model$ModelInfo$plots$centre_heatmap
 model$ModelInfo$plots$centre_profile
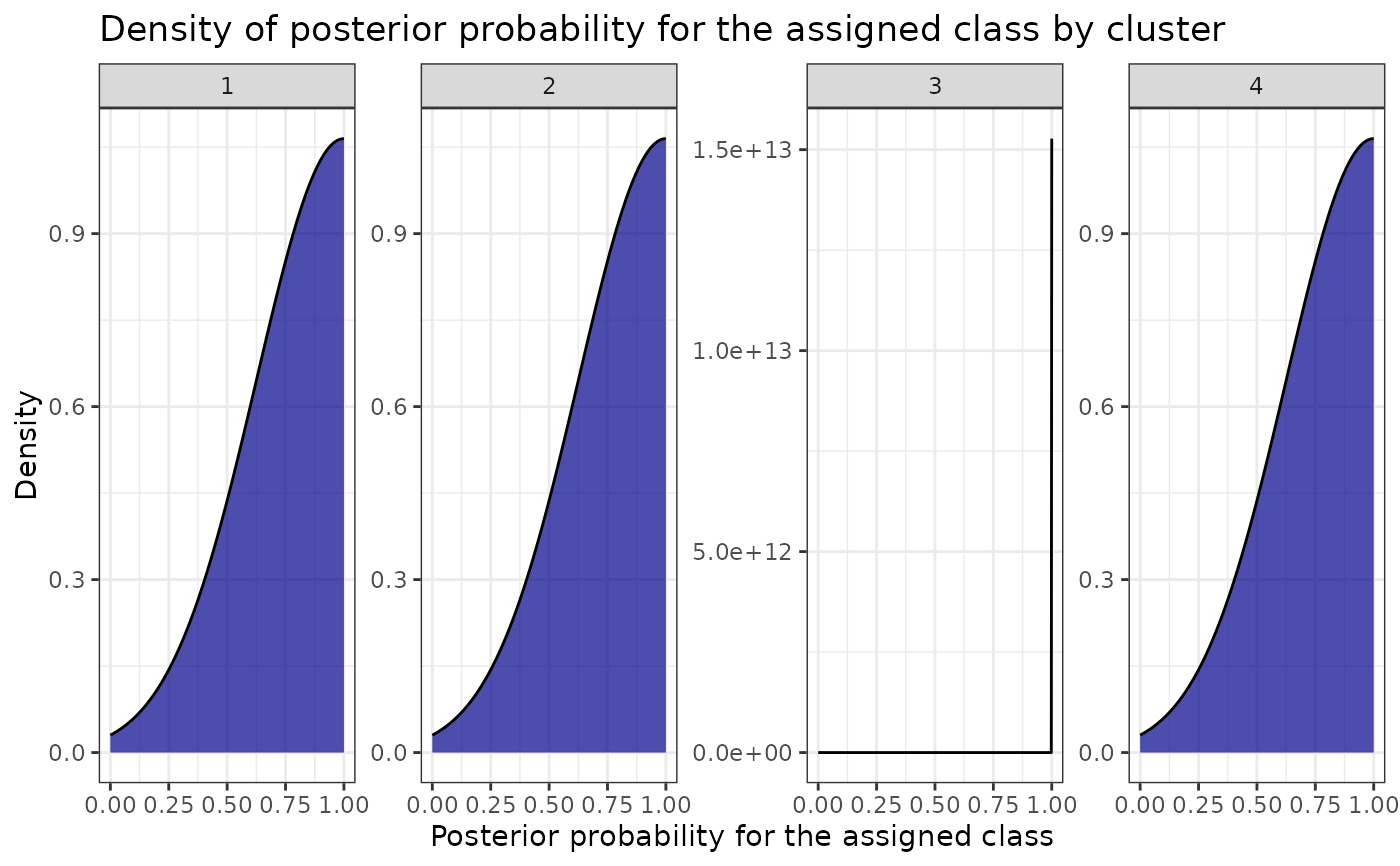
 model$ProbFit$plots$confidence_density
 projected <- ProjectCluster(model, df_Projection)
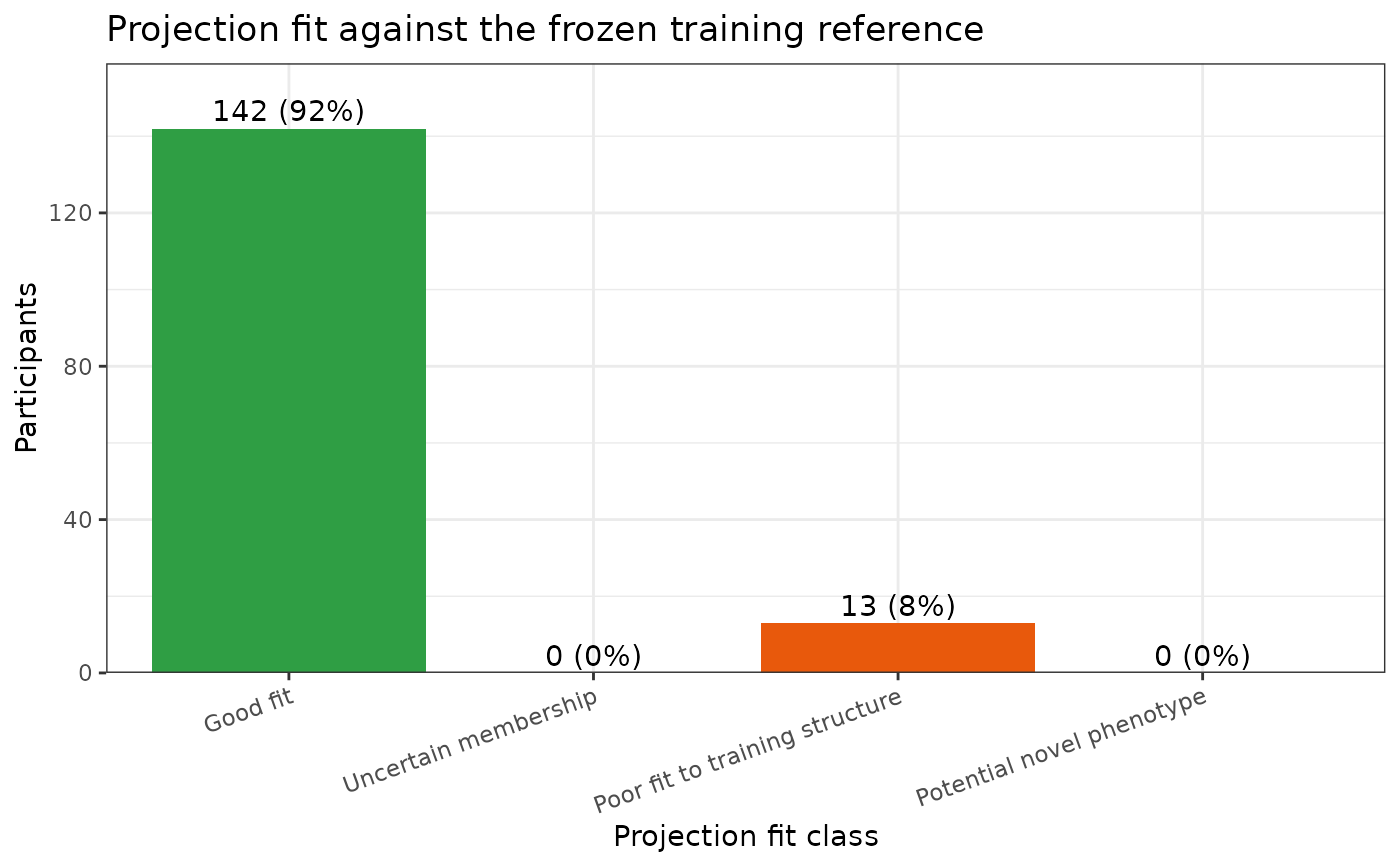
projected$ProjectionFit$plots$projection_fit_class_bar
projected <- ProjectCluster(model, df_Projection)
projected$ProjectionFit$plots$projection_fit_class_bar
 # }
# }