This function performs Multiple Correspondence Analysis (MCA) on a set of categorical variables, imputes missing data if needed, and generates a set of visualizations and tables to interpret the results.
CreateMCATable() has been superseded by CreateMCAObject().
It remains available as a backwards-compatible alias and returns the same
reusable MCA object.
Usage
CreateMCAObject(
  data,
  VarsToReduce,
  VariableCategories = NULL,
  minThresh = 75,
  scale = TRUE,
  center = TRUE,
  Relabel = TRUE,
  Ordinal = FALSE,
  numComponents = NULL,
  ImputeMissing = FALSE,
  Data = lifecycle::deprecated()
)

CreateMCATable(...)
Arguments
- data
A dataframe containing the data to be analyzed.
- VarsToReduce
A vector of column names in
Datato be included in the MCA.- VariableCategories
An optional vector to assign specific categories to the variables in
VarsToReduce. These will be used to color the loadings plot.- minThresh
A numeric value representing the minimum cumulative variance threshold to determine the number of components. Default is 75%.
- scale
Logical, indicating whether to scale the variables. Default is TRUE.
- center
Logical, indicating whether to center the variables. Default is TRUE.
- Relabel
Logical, if TRUE, the function will replace missing labels in the data using an external helper function
ReplaceMissingLabels. Default is TRUE.- Ordinal
Logical, if TRUE, the function will treat variables as ordinal for MCA. Default is FALSE.
- numComponents
An optional integer specifying the number of components to retain. If NULL, the number of components will be determined based on
minThresh.- ImputeMissing
Logical, if TRUE, missing values will be imputed using
missRanger. Default is FALSE.- Data
Deprecated (since 19.15.0). Use
datainstead.- ...
Arguments passed to
CreateMCAObject().
Value
A list with the following elements:
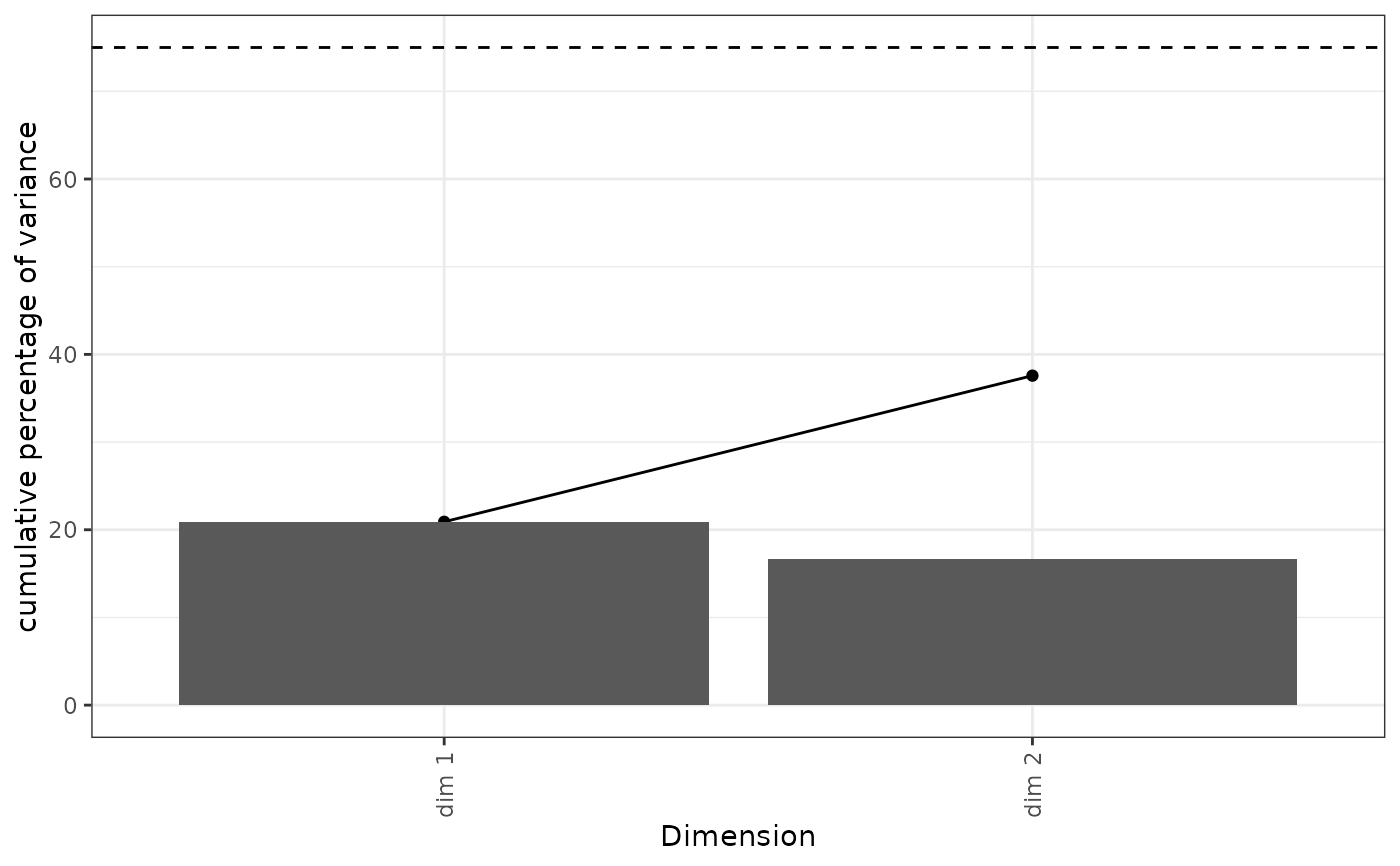
- p_scree
A
ggplotobject representing the scree plot, showing the cumulative and percentage of variance explained by each component.- pcaresults
The MCA results object, which includes component scores and contributions.
- LoadingTable
A data frame with the variable loadings for each component.
- Scores
A data frame with the MCA scores for each individual in the data.
- CombinedData
The original data combined with the MCA scores.
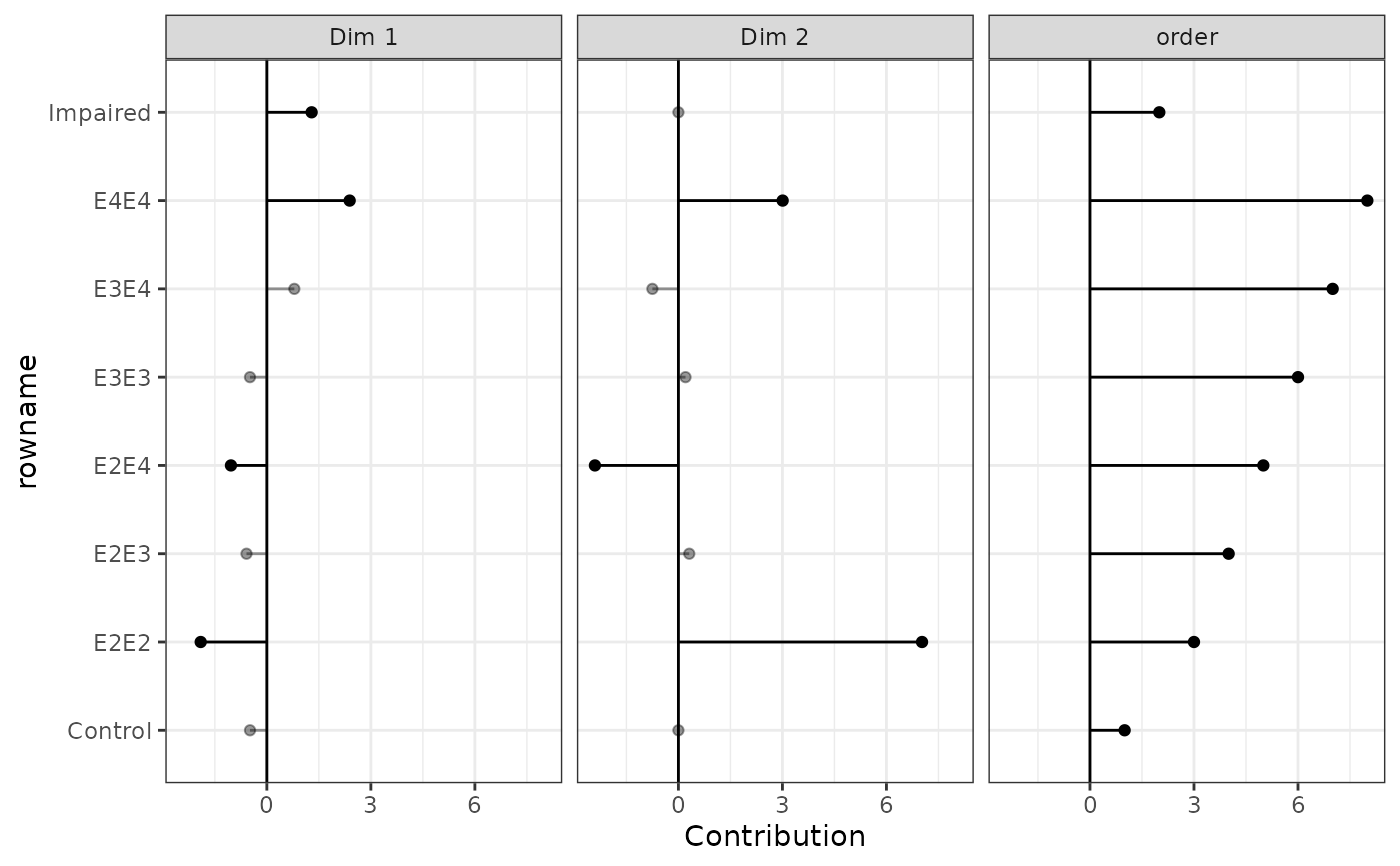
- Lollipop
A
ggplotobject showing a lollipop plot of variable loadings across components.
Details
Optional dependencies used by this workflow include missRanger for
imputation and FactoMineR for MCA calculation. These packages are listed
in DESCRIPTION and should be installed for MCA workflows.
Examples
data(SampleData)
data(SampleVariableTypes)
Labelled <- RevalueData(SampleData, SampleVariableTypes)$RevaluedData
mca <- CreateMCAObject(
Labelled,
VarsToReduce = c("Diagnosis", "Genotype")
)
# Variance explained by MCA dimensions
mca$p_scree
 # Variable loadings across MCA dimensions
mca$Lollipop
# Variable loadings across MCA dimensions
mca$Lollipop