Create normative T-scores from a regression model
Source:R/CreateNormativeTScores.R
CreateNormativeTScoreModel.RdFits a normative regression model in a user-defined reference subgroup and uses the model residual standard deviation to convert observed scores into z-scores and T-scores. This is useful for creating demographically adjusted cognitive norms with optional practice effect adjustment and optional preprocessing such as unit conversion, log transformation, and reverse scoring.
CreateNormativeTScores() has been superseded by
CreateNormativeTScoreModel(). It remains available as a
backwards-compatible alias and returns the same reusable normative model.
Usage
CreateNormativeTScoreModel(
  data,
  test_var,
  count_var,
  covariates,
  reference_var,
  reference_value,
  include_practice_effect = FALSE,
  baseline_count_value = 1,
  reverse_score = FALSE,
  convert_seconds = FALSE,
  seconds_divisor = 1000,
  log_transform = TRUE,
  codebook = NULL,
  return_plots = TRUE,
  df = lifecycle::deprecated()
)

CreateNormativeTScores(...)
Arguments
- data
A data frame containing the test variable, count variable, reference group variable, and covariates.
- test_var
A character string naming the raw test score variable.
- count_var
A character string naming the visit count or practice count variable.
- covariates
A character vector of covariate column names to include in the normative model.
- reference_var
A character string naming the variable used to define the normative reference group.
- reference_value
The value of
reference_varthat defines the normative reference group.- include_practice_effect
Logical. If
TRUE,count_varis included as a predictor and the model is fit using all available visits in the reference group. IfFALSE, the model is fit only on rows wherecount_var == baseline_count_value.- baseline_count_value
The value of
count_varused to define the baseline visit wheninclude_practice_effect = FALSE. Defaults to1.- reverse_score
Logical. If
TRUE, the analysis-scale score is multiplied by-1so that higher values reflect better performance.- convert_seconds
Logical. If
TRUE, the raw score is divided byseconds_divisorbefore further processing.- seconds_divisor
Numeric divisor used when
convert_seconds = TRUE. Defaults to1000.- log_transform
Logical. If
TRUE, applieslog10()to the analysis score after optional unit conversion and before optional reverse scoring.- codebook
Optional data frame with columns
VariableandLabel. If supplied, plot labels use variable labels when available.- return_plots
Logical. If
TRUE, returns a list of diagnostic plots.- df
Deprecated (since 19.15.0). Use
datainstead.- ...
Arguments passed to
CreateNormativeTScoreModel().
Value
A list with the following elements:
- data
A tibble containing the original data plus
NormRaw,NormScaled,NormPredicted,NormZ, andNormT.- model
The fitted
lmobject.- model_summary
A tibble of coefficient estimates.
- model_fit
A one-row tibble containing model fit statistics.
- training_data
The rows used to fit the normative model.
- plots
A named list of ggplot objects when
return_plots = TRUE.- settings
A list of preprocessing and modeling settings used.
Details
The reference group is defined by reference_var == reference_value.
When include_practice_effect = FALSE, the normative model is fit only on
rows where count_var == baseline_count_value. When
include_practice_effect = TRUE, count_var is added to the model and all
available visits in the reference group are used.
Examples
# A reference sample large enough to estimate the covariate effects
set.seed(4127)
n_Reference <- 240
n_Clinical <- 60
n_Total <- n_Reference + n_Clinical
df <- tibble::tibble(
Group = c(rep("Reference", n_Reference), rep("Clinical", n_Clinical)),
Age = round(stats::rnorm(n_Total, mean = 55, sd = 12)),
Education = factor(sample(
c("High School", "College", "Graduate"), n_Total, replace = TRUE
)),
Sex = factor(sample(c("F", "M"), n_Total, replace = TRUE)),
Visit = sample(1:3, n_Total, replace = TRUE)
)
# Trail Making A: slower with age, faster with practice, slower if impaired
df$TrailsA <- 1000 * exp(
3.35 +
0.011 * (df$Age - 55) -
0.04 * (df$Visit - 1) +
0.30 * (df$Group == "Clinical") +
stats::rnorm(n_Total, sd = 0.16)
)
out <- CreateNormativeTScoreModel(
data = df,
test_var = "TrailsA",
count_var = "Visit",
covariates = c("Age", "Education", "Sex"),
reference_var = "Group",
reference_value = "Reference",
include_practice_effect = TRUE,
reverse_score = TRUE,
convert_seconds = TRUE,
log_transform = TRUE,
return_plots = TRUE
)
out$data
#> # A tibble: 300 × 12
#> Group Age Education Sex Visit TrailsA NormRaw NormCount NormScaled
#> <chr> <dbl> <fct> <fct> <int> <dbl> <dbl> <int> <dbl>
#> 1 Reference 41 College F 3 17342. 17342. 3 -1.24
#> 2 Reference 67 College F 3 37218. 37218. 3 -1.57
#> 3 Reference 39 Graduate M 1 27135. 27135. 1 -1.43
#> 4 Reference 44 College F 1 21339. 21339. 1 -1.33
#> 5 Reference 52 High School M 3 25994. 25994. 3 -1.41
#> 6 Reference 55 College F 2 35301. 35301. 2 -1.55
#> 7 Reference 48 Graduate M 2 25963. 25963. 2 -1.41
#> 8 Reference 65 High School F 1 28792. 28792. 1 -1.46
#> 9 Reference 51 Graduate F 1 26848. 26848. 1 -1.43
#> 10 Reference 51 College F 3 19637. 19637. 3 -1.29
#> # ℹ 290 more rows
#> # ℹ 3 more variables: NormPredicted <dbl>, NormZ <dbl>, NormT <dbl>
out$model
#>
#> Call:
#> stats::lm(formula = model_formula, data = training_data)
#>
#> Coefficients:
#> (Intercept) Age EducationGraduate
#> -1.198621 -0.004948 -0.008704
#> EducationHigh School SexM Visit
#> -0.004038 -0.005448 0.021899
#>
# Raw, transformed, and normed score distributions
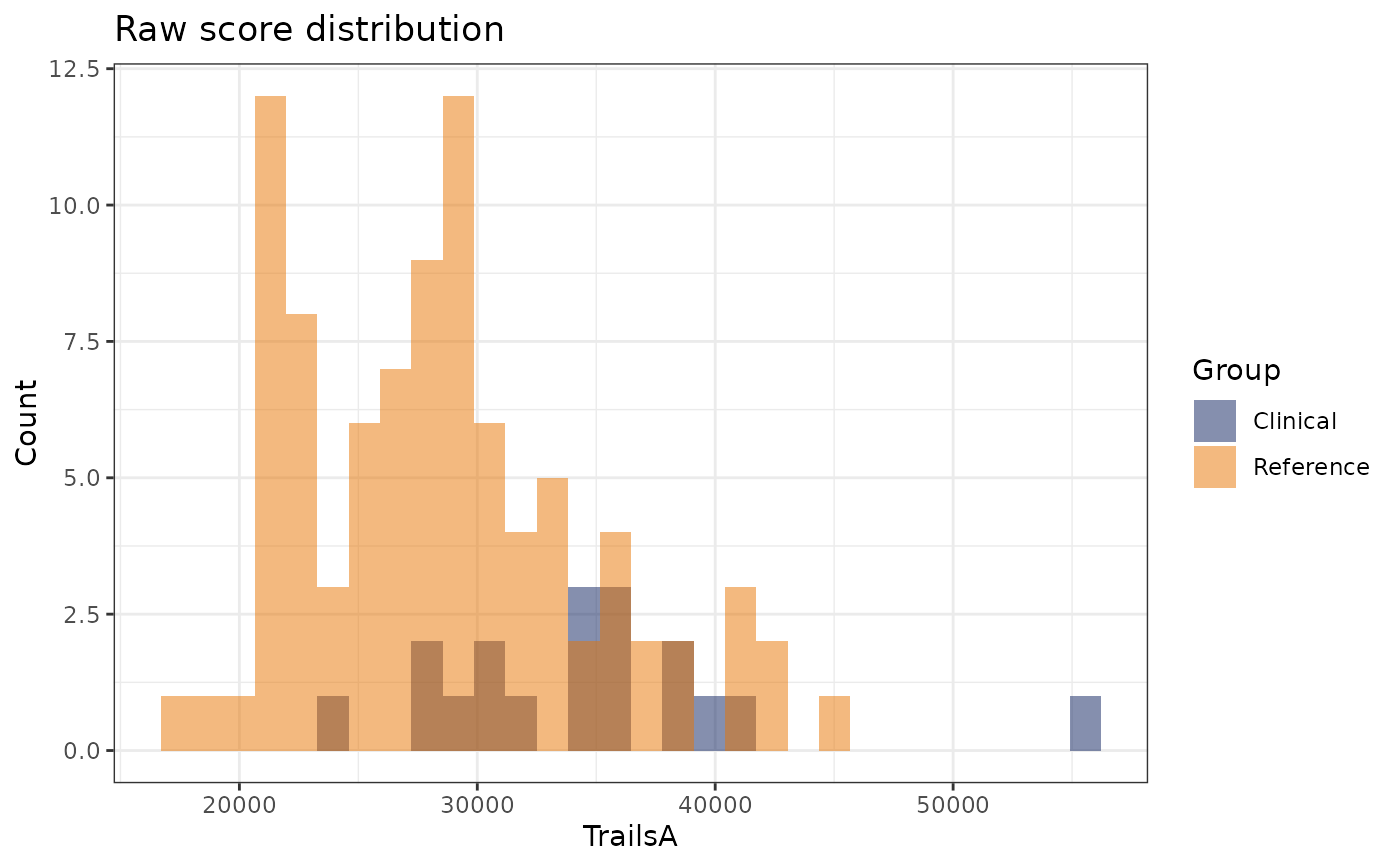
out$plots$raw
#> `stat_bin()` using `bins = 30`. Pick better value `binwidth`.
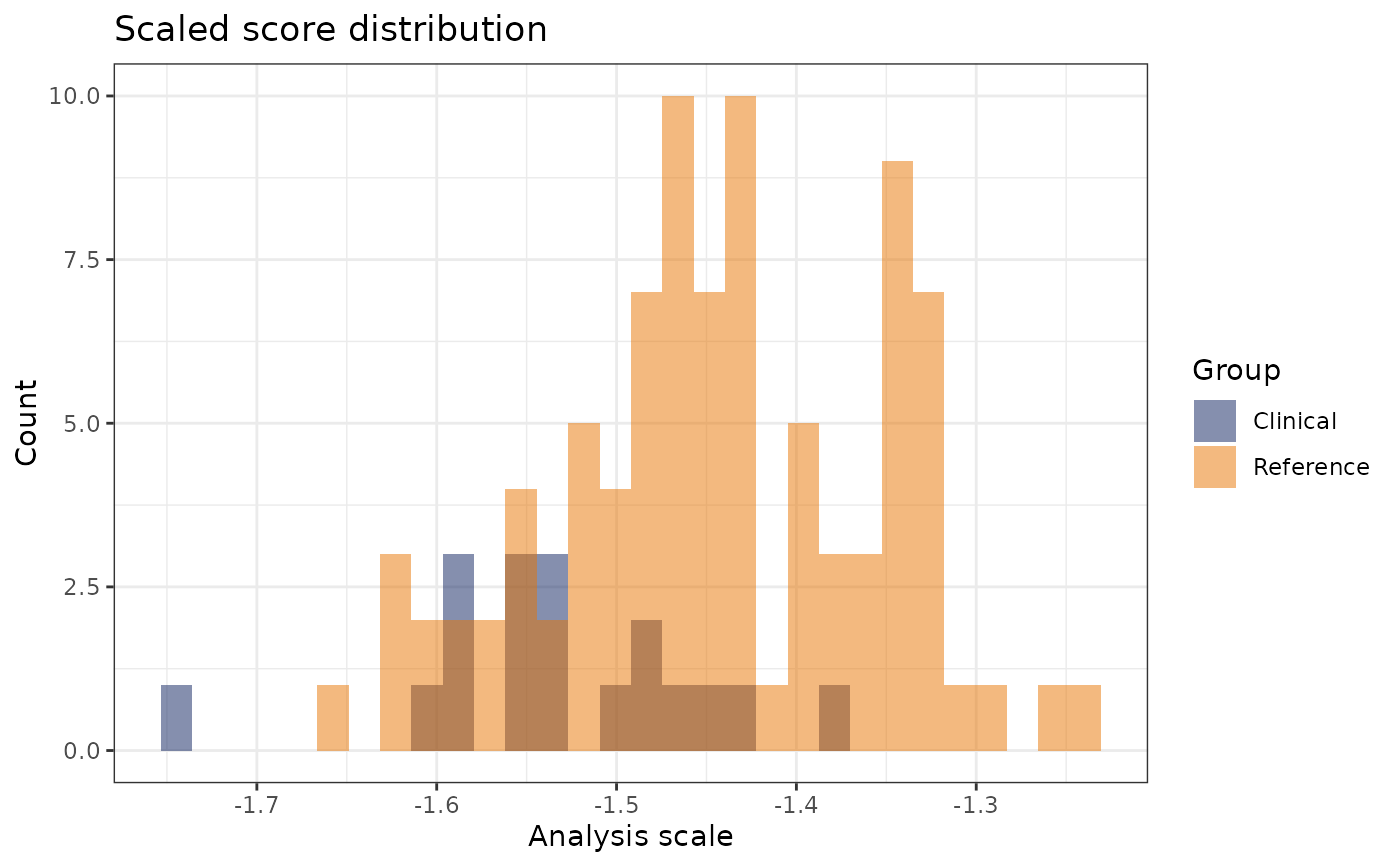
 out$plots$scaled
#> `stat_bin()` using `bins = 30`. Pick better value `binwidth`.
out$plots$scaled
#> `stat_bin()` using `bins = 30`. Pick better value `binwidth`.
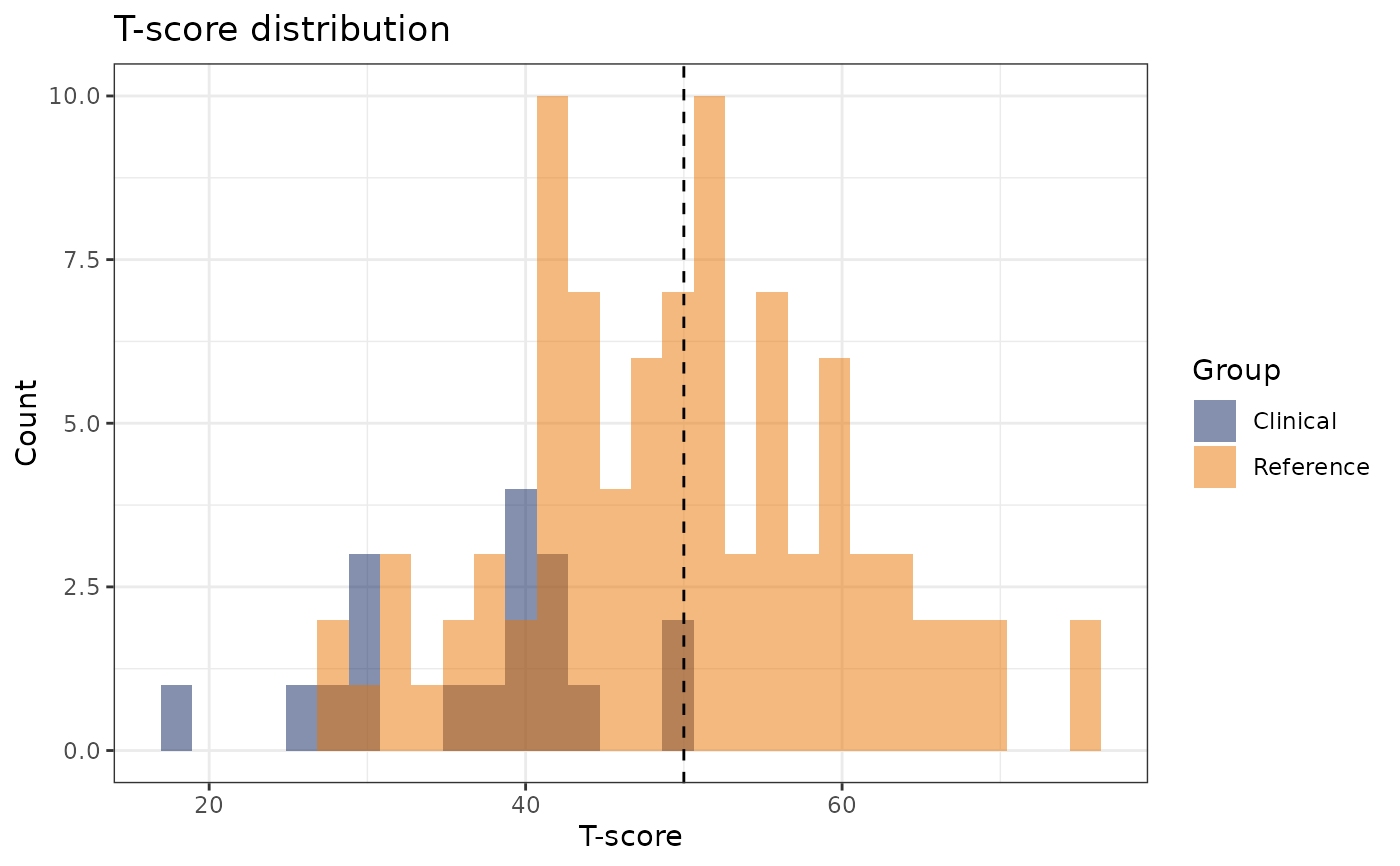
 out$plots$tscore
#> `stat_bin()` using `bins = 30`. Pick better value `binwidth`.
out$plots$tscore
#> `stat_bin()` using `bins = 30`. Pick better value `binwidth`.
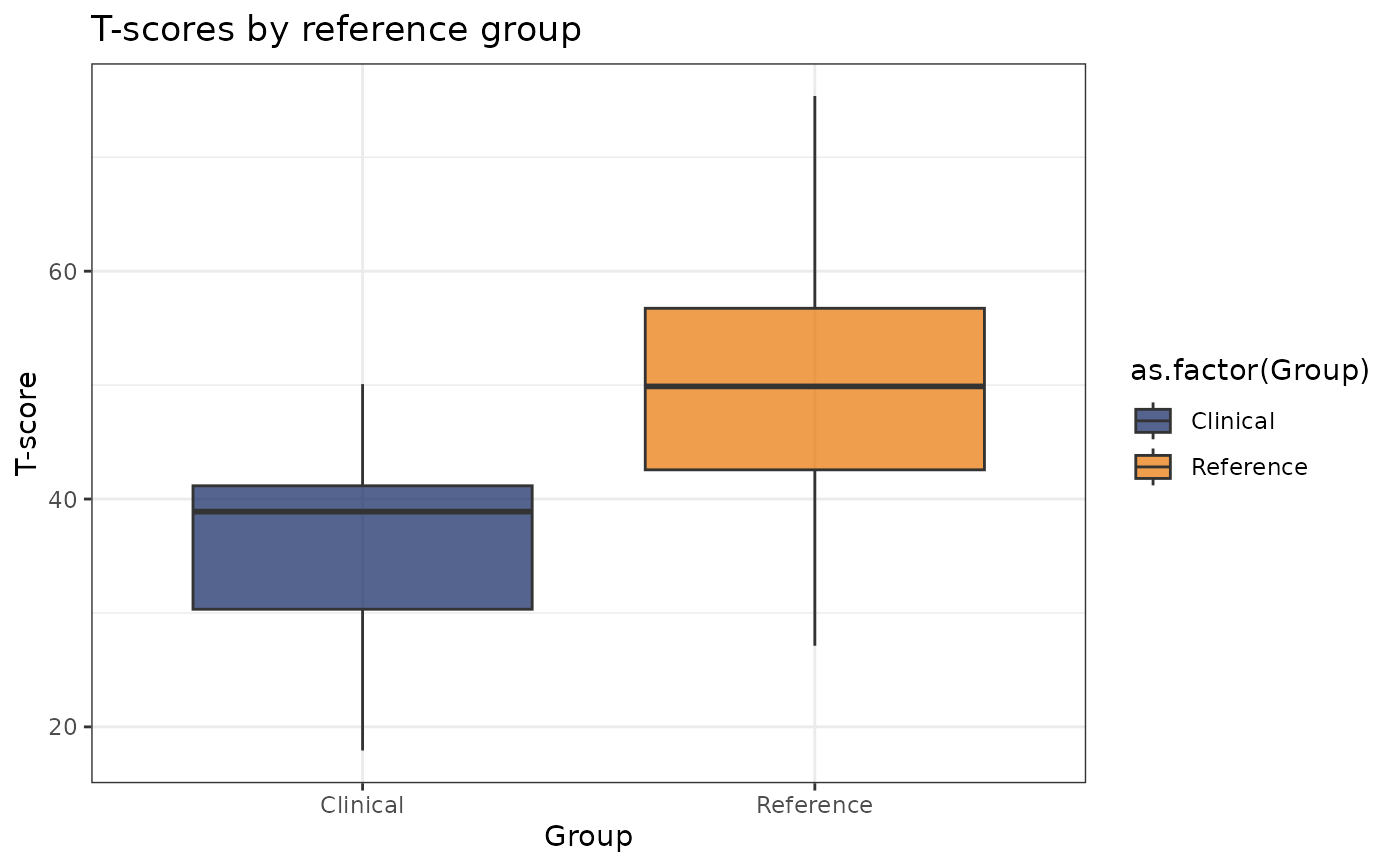
 # T-score diagnostics by reference group, practice count, and covariates
out$plots$reference
# T-score diagnostics by reference group, practice count, and covariates
out$plots$reference
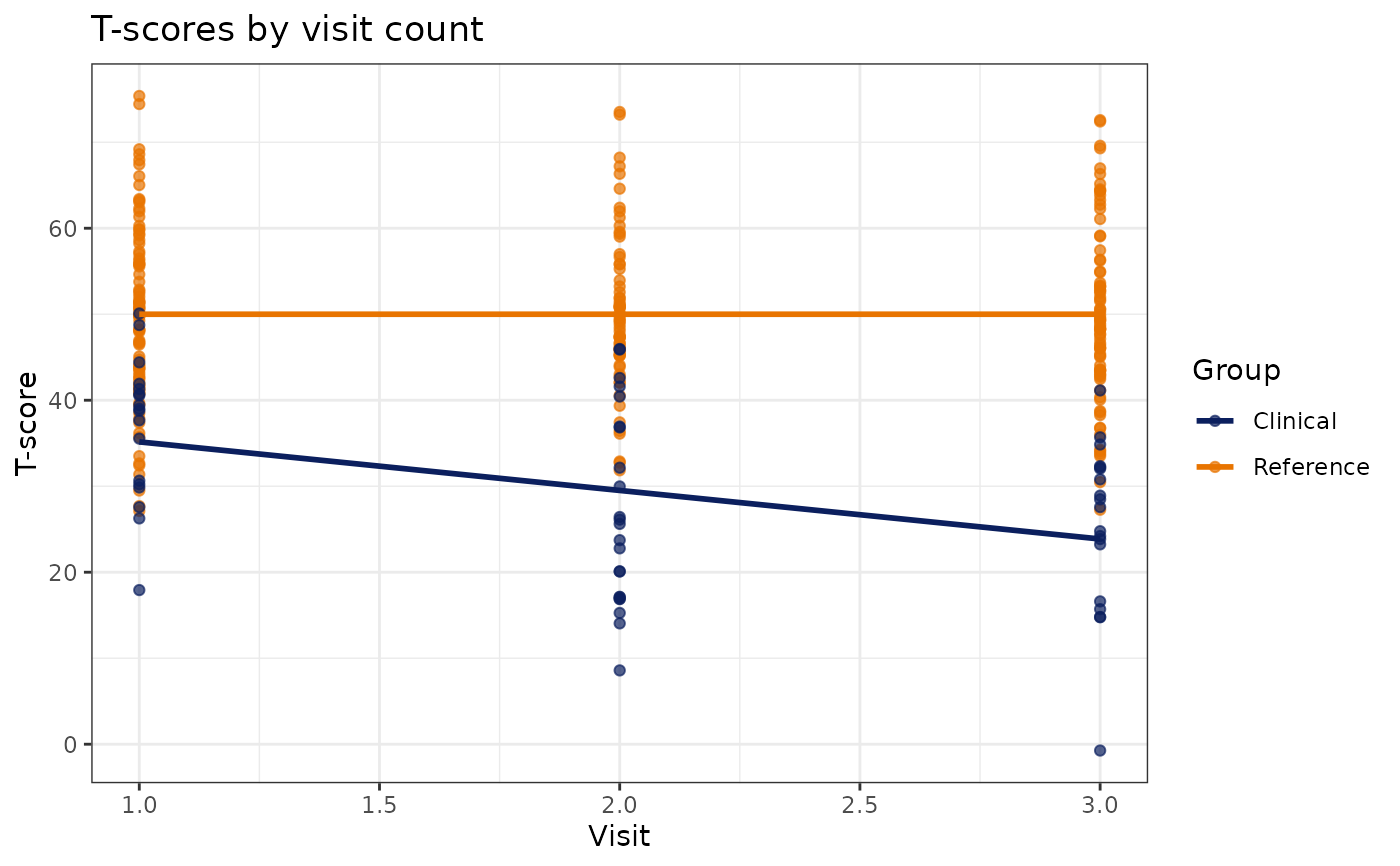
 out$plots$practice
#> `geom_smooth()` using formula = 'y ~ x'
out$plots$practice
#> `geom_smooth()` using formula = 'y ~ x'
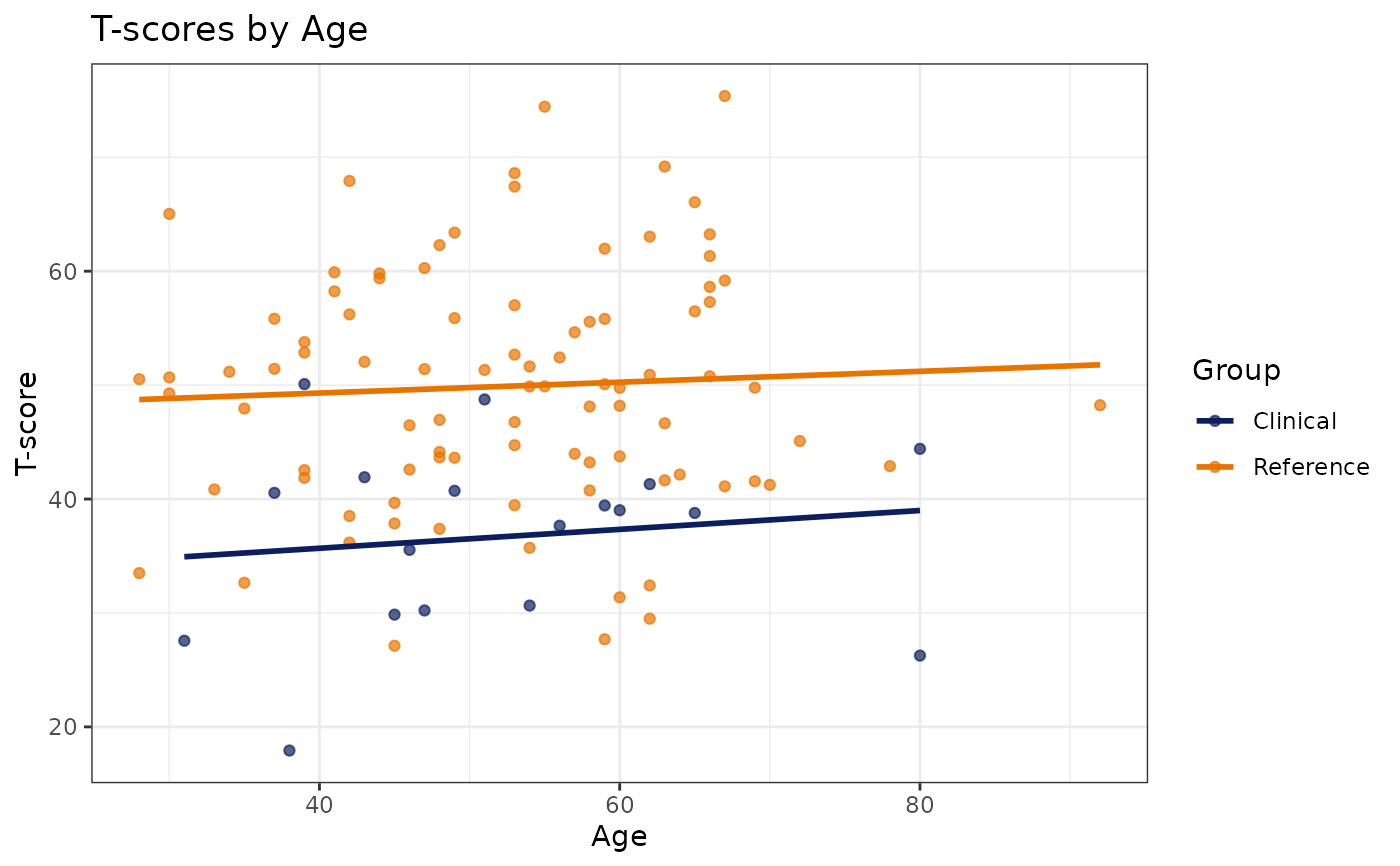
 out$plots$Age
#> `geom_smooth()` using formula = 'y ~ x'
out$plots$Age
#> `geom_smooth()` using formula = 'y ~ x'
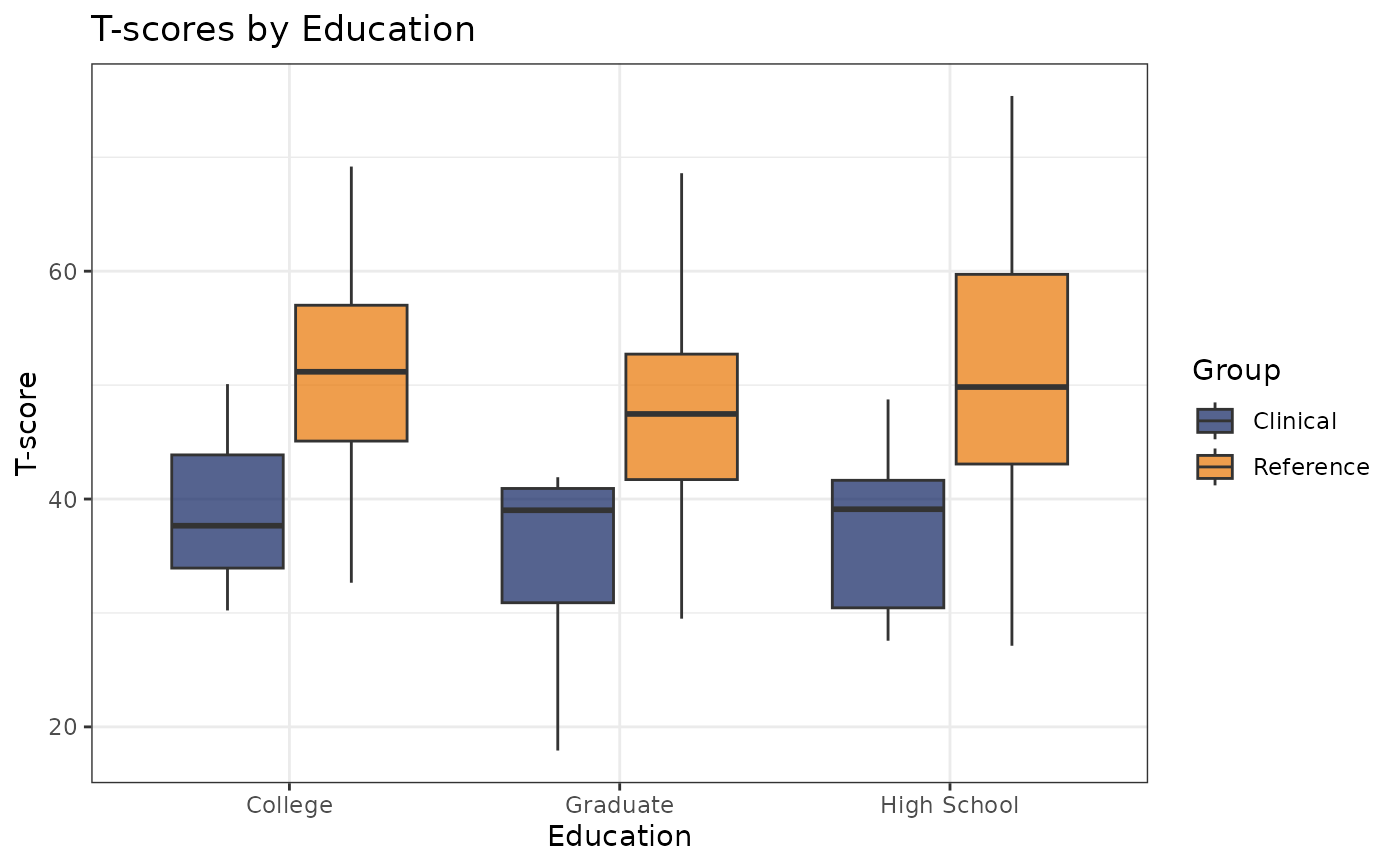
 out$plots$Education
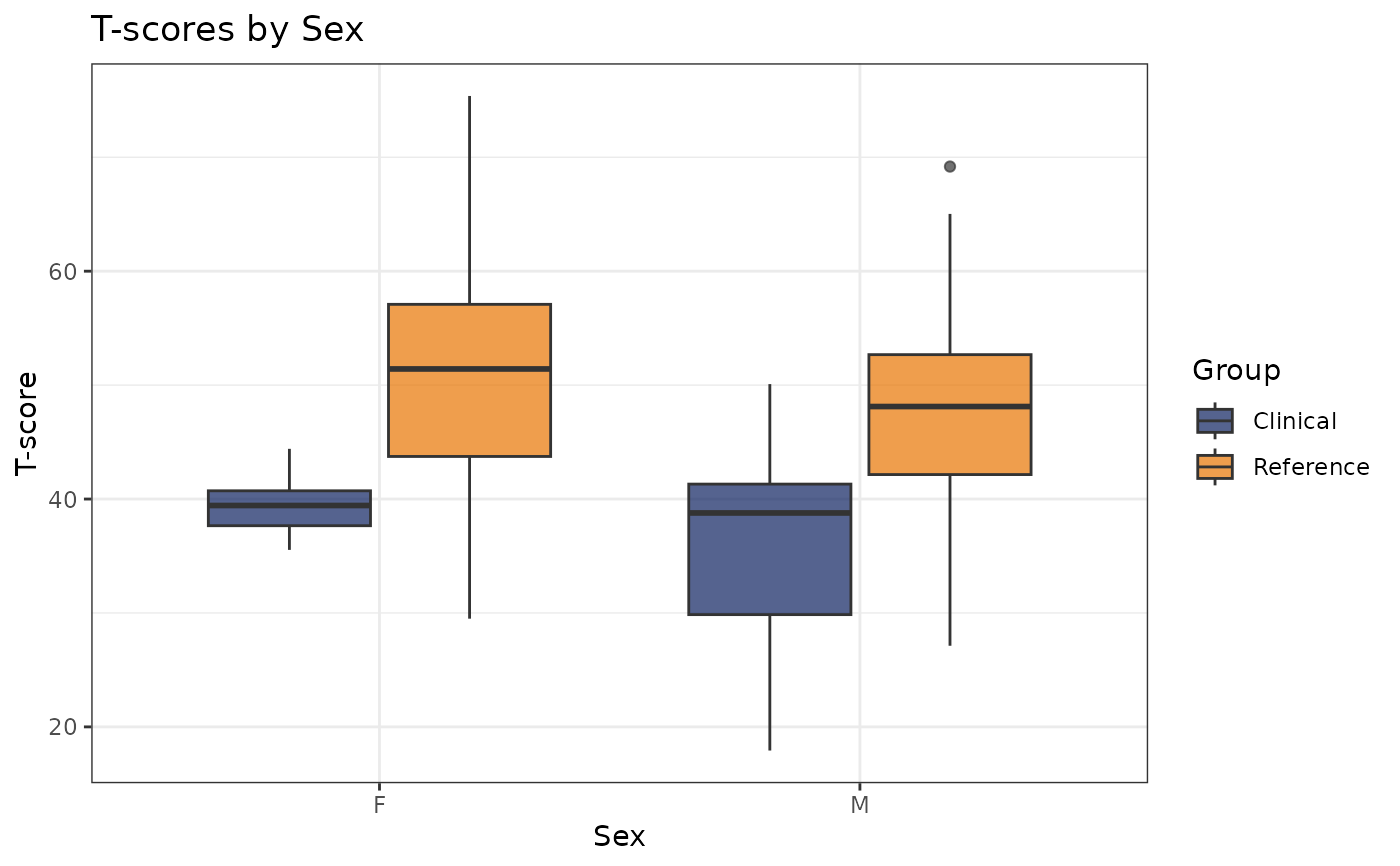
 out$plots$Sex