Learn regression-based Reliable Change Index (RCI) models relative to a user-defined reference visit and calculate projected RCI values.
Usage
CreateRCIObject(
  data,
  variables,
  DataFormat = c("wide", "long"),
  id_var,
  Method = "regression",
  BaselineSpecifier = NULL,
  FollowupSpecifier = NULL,
  SpecifierPosition = c("suffix", "prefix"),
  VisitColumn = NULL,
  VisitOrder = NULL,
  BaselineVisit = NULL,
  Confidence = 0.95,
  Relabel = TRUE,
  Data = lifecycle::deprecated(),
  Variables = lifecycle::deprecated(),
  ID = lifecycle::deprecated()
)
Arguments
- data
A data frame.
- variables
Character vector of canonical variable names.
- DataFormat
Either "wide" or "long".
- id_var
ID column.
- Method
Currently only "regression" is supported.
- BaselineSpecifier
Baseline visit identifier for wide data.
- FollowupSpecifier
Follow-up visit identifier for wide data.
- SpecifierPosition
Either "suffix" or "prefix".
- VisitColumn
Visit column for long data.
- VisitOrder
Optional ordering of visits.
- BaselineVisit
Reference visit used for RCI calculations.
- Confidence
Confidence interval threshold.
- Relabel
Logical; use variable labels when available.
#'
- Data
Deprecated (since 19.15.0). Use
datainstead.- Variables
Deprecated (since 19.15.0). Use
variablesinstead.- ID
Deprecated (since 19.15.0). Use
id_varinstead.
Details
Supports both wide and long longitudinal data structures.
Long format is recommended for datasets with more than two visits.
Examples
set.seed(20260803)
rci_data <- data.frame(
id = rep(1:30, each = 2),
visit = rep(c("Baseline", "Followup"), 30),
Score = round(rnorm(60, mean = 50, sd = 10), 1)
)
# Use a +/-1 cutoff here so all three change classifications are visible.
# The default Confidence = 0.95 retains the conventional +/-1.96 cutoff.
rci <- CreateRCIObject(
data = rci_data,
variables = "Score",
DataFormat = "long",
id_var = "id",
VisitColumn = "visit",
BaselineVisit = "Baseline",
Confidence = 0.68
)
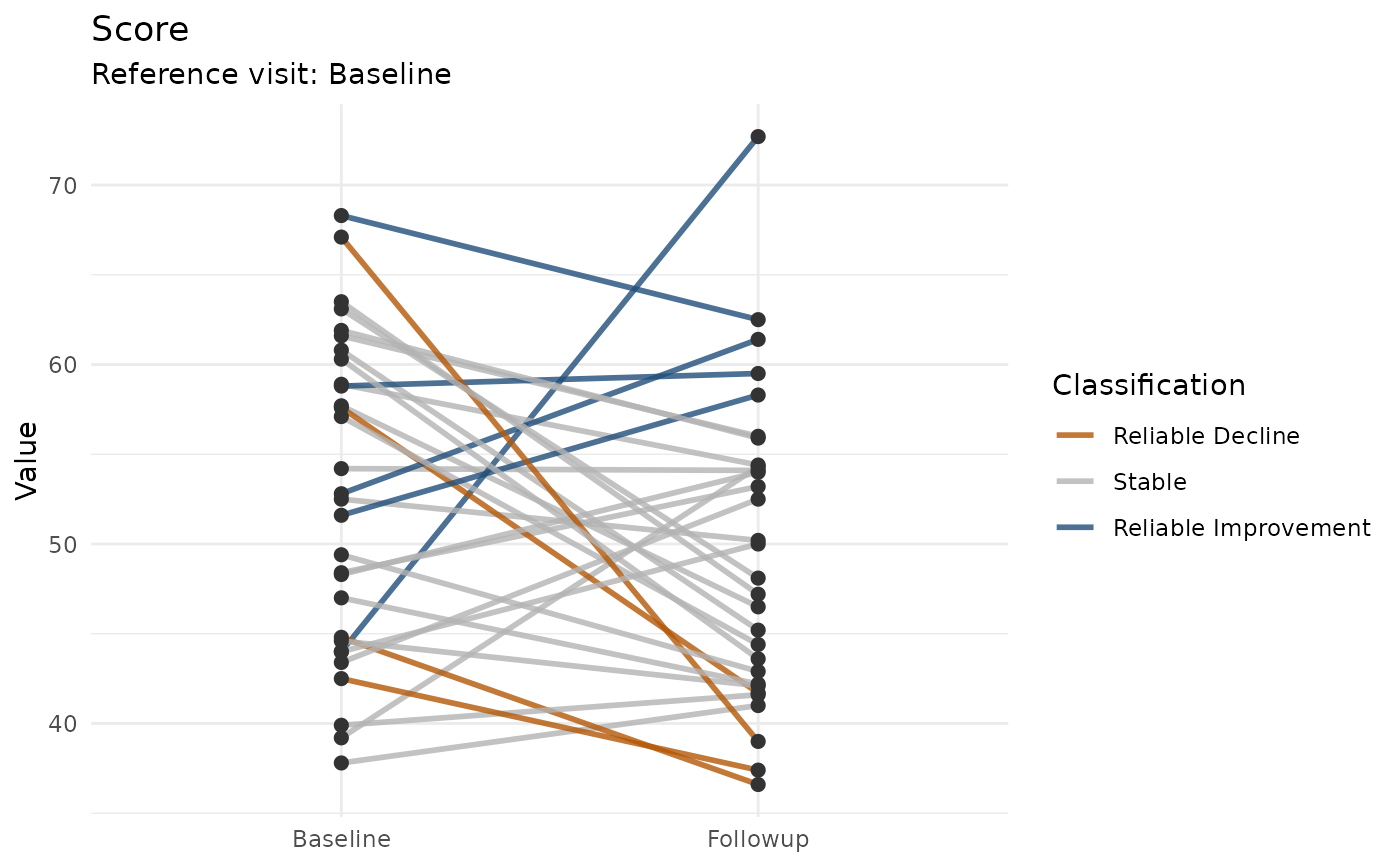
# Individual trajectories across visits
rci$Plots$Spaghetti$Score
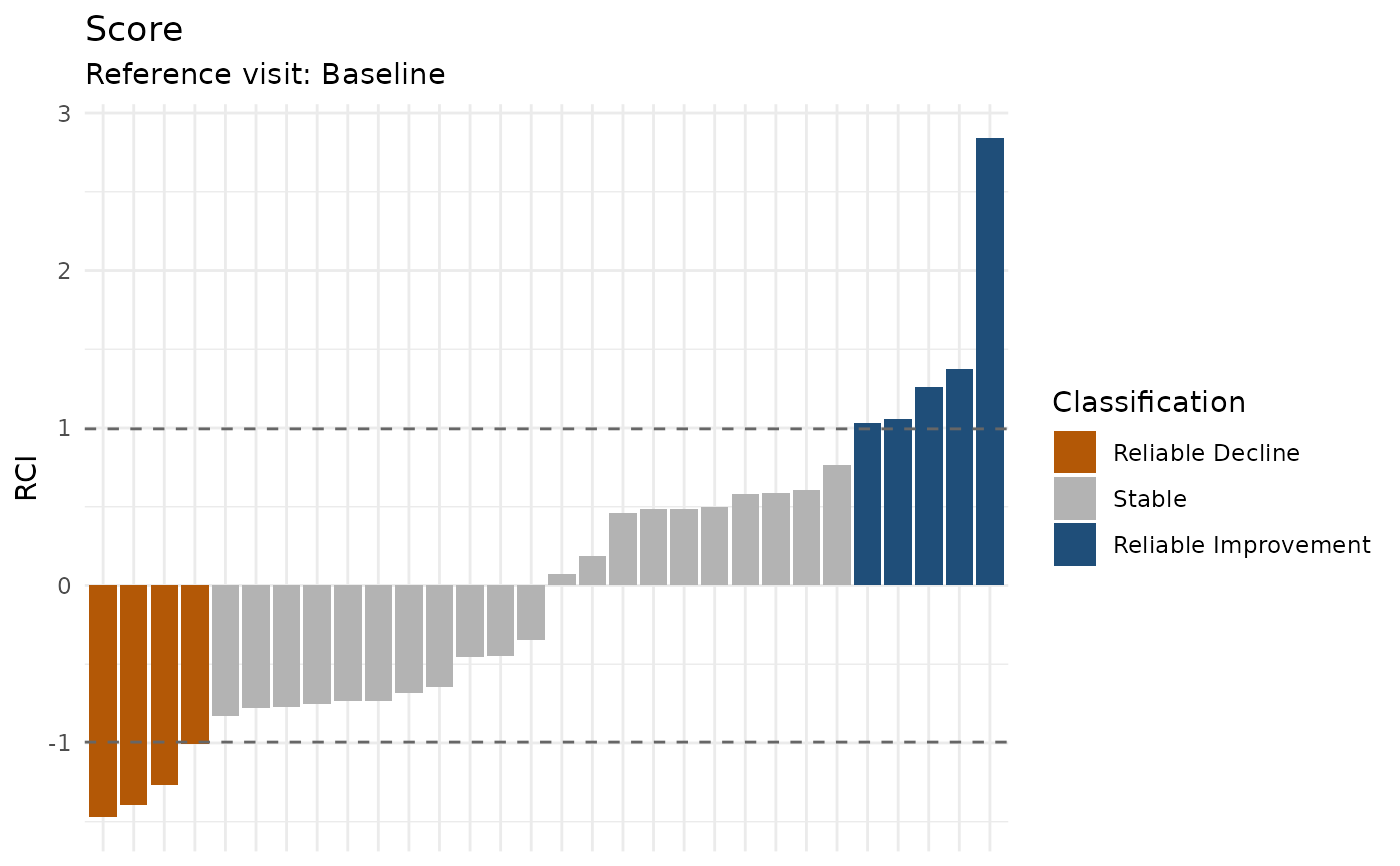
 # Participant-level reliable-change values
rci$Plots$Waterfall$Score
# Participant-level reliable-change values
rci$Plots$Waterfall$Score
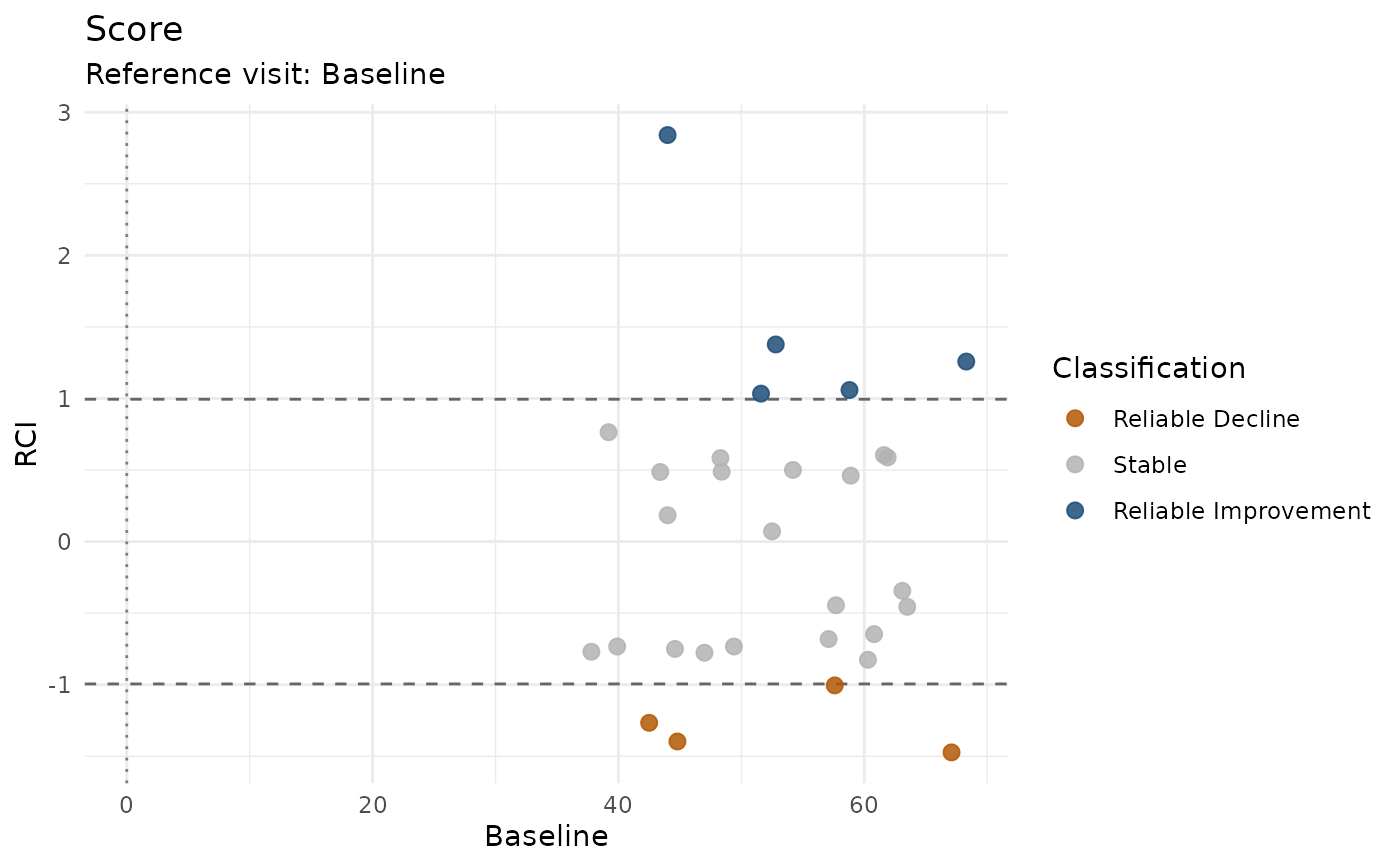
 # Baseline values relative to reliable change
rci$Plots$Quadrant$Score
# Baseline values relative to reliable change
rci$Plots$Quadrant$Score