
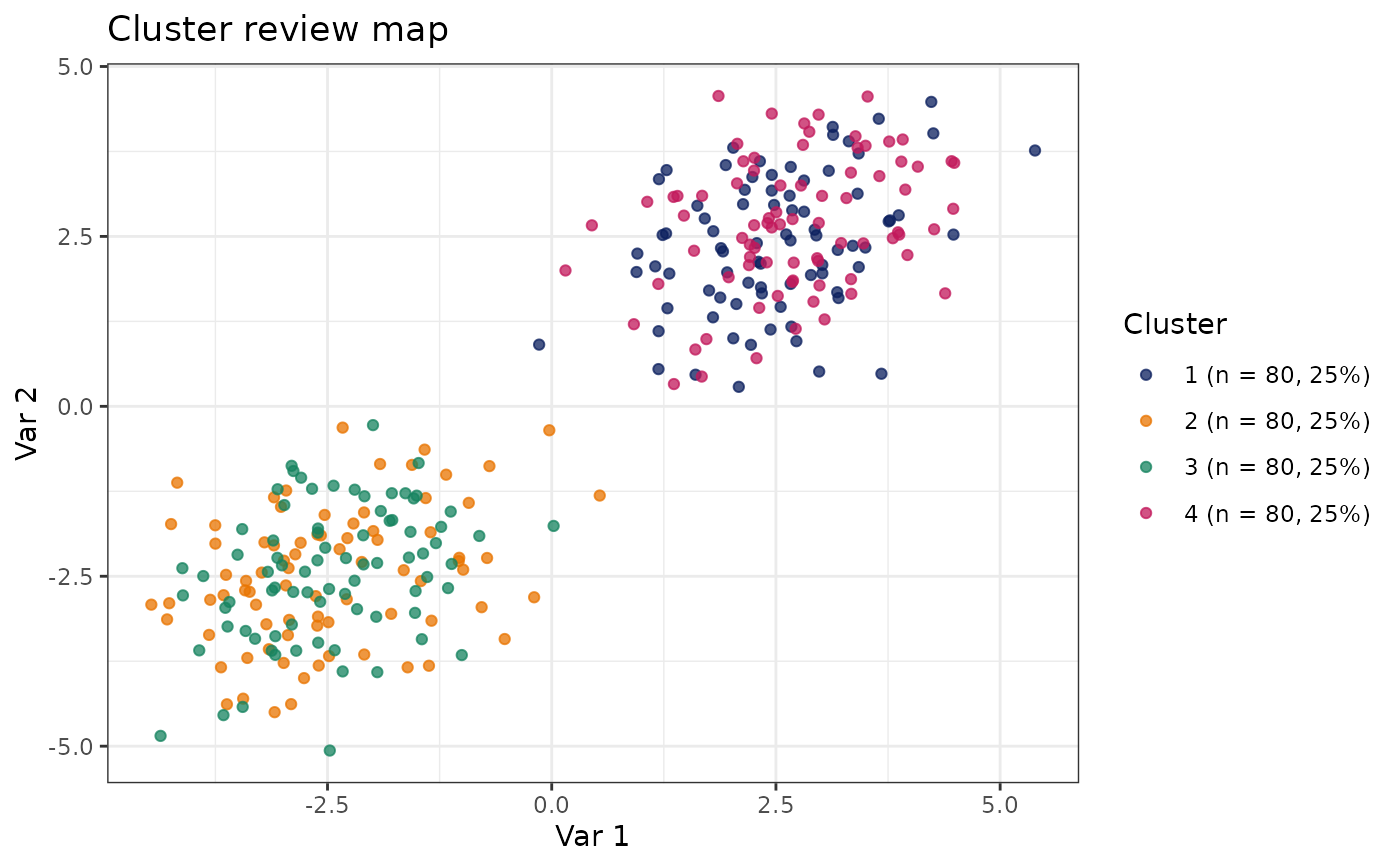
Cluster assignments in a two-dimensional review space. The space is frozen at training time and reused for projection so training and projected cases are directly comparable. It is a display space only and does not affect the clustering itself.
Usage
PlotClusterMap(
  data,
  x,
  y,
  ClusterVar = "Cluster",
  centroids = NULL,
  title = "Cluster review map",
  subtitle = NULL,
  xlab = NULL,
  ylab = NULL,
  noise_label = 0L
)

PlotClusterAssignment(data, x, y, ClusterVar = "Cluster")
Arguments
- data
Data frame containing coordinates and a cluster column.
- x, y
Coordinate variable names.
- ClusterVar
Cluster column name.
- centroids
Optional data frame of centroid coordinates in the same two columns, overlaid as crosses.
- title, subtitle, xlab, ylab
Plot annotations.
- noise_label
Cluster value treated as noise, or
NULLto disable.
Examples
# \donttest{
data(SimulatedPhenotypeData)
df_Training <- dplyr::filter(SimulatedPhenotypeData, .data$Cohort == "Training")
model <- CreateClusterModel_KMeans(
df_Training, paste0("Var", 1:12), method = "finalize", final_k = 4
)
PlotClusterMap(model$DataWithClusters, "Var1", "Var2", "Cluster")
 # }
# }