
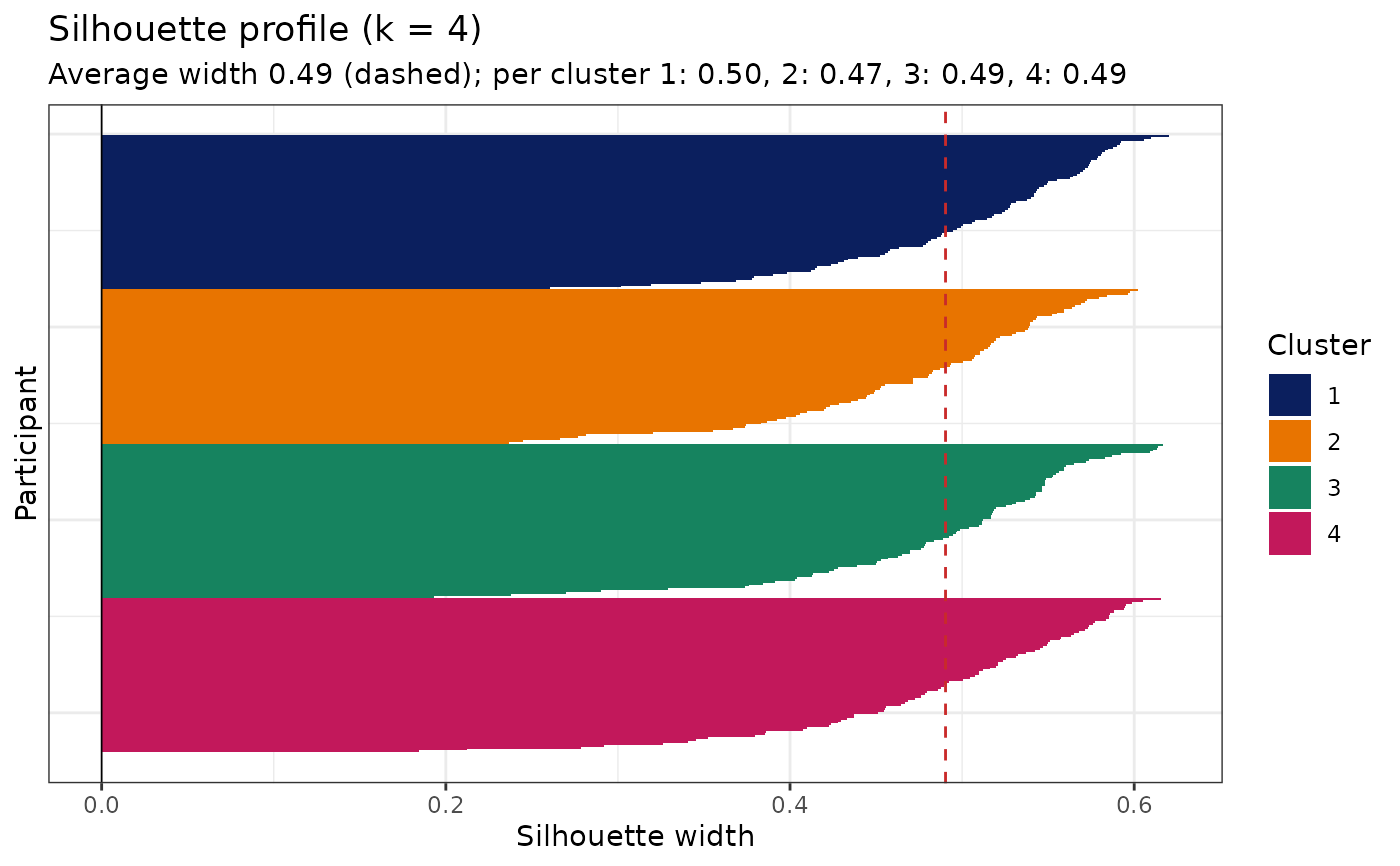
The classic silhouette profile: one bar per participant, sorted within cluster, with the average silhouette width marked. Bars near zero or below sit closer to a neighbouring cluster than their own.
Arguments
- silhouette
A
cluster::silhouette()object or a matrix withcluster,neighbor, andsil_widthcolumns.- title
Plot title.
Examples
# \donttest{
data(SimulatedPhenotypeData)
df_Training <- dplyr::filter(SimulatedPhenotypeData, .data$Cohort == "Training")
model <- CreateClusterModel_KMeans(
df_Training, paste0("Var", 1:12), method = "finalize", final_k = 4
)
model$ModelInfo$plots$silhouette
 # }
# }