Plot a diagnostic likelihood-ratio heatmap
Source:R/PlotDiagnosticLRHeatmap.R
PlotDiagnosticLRHeatmap.RdVisualizes results created by DiagnosticLikelihoodRatioTable() without
recomputing statistics. Tile fill is log2(LR), so reciprocal evidence is
equally distant from LR 1. Multi-outcome input can return a compact screening
overview alongside outcome-specific diagnostic panels.
Usage
PlotDiagnosticLRHeatmap(
  x,
  result = c("all", "positive", "negative"),
  predictor_order = c("original", "alphabetical", "strength", "cluster"),
  outcome_order = c("original", "alphabetical", "strength", "cluster"),
  orientation = c("auto", "predictors_rows", "outcomes_rows"),
  show_values = "auto",
  show_ci_marker = TRUE,
  facet_strata = TRUE,
  cap = NULL,
  na_color = "grey90",
  multi_outcome = c("auto", "combined", "split")
)
Arguments
- x
An object returned by
DiagnosticLikelihoodRatioTable(), or a tidy data frame compatible with itsResultselement.- result
Diagnostic result levels to display:
"all","positive", or"negative". Positive and negative selections require the result object.- predictor_order
Predictor ordering:
"original","alphabetical","strength", or"cluster".- outcome_order
Outcome ordering with the same choices.
- orientation
Tile orientation:
"auto","predictors_rows", or"outcomes_rows".- show_values
"auto",TRUE, orFALSE; auto labels at most 150 tiles.- show_ci_marker
Logical; append
*when the unadjusted LR CI excludes 1.- facet_strata
Logical; facet separate diagnostic strata when present.
- cap
Optional positive maximum absolute log2(LR) for color scaling.
- na_color
Fill color for unavailable LR values.
- multi_outcome
Multi-outcome display:
"auto"returns a split overview/panel list for multiple outcomes,"combined"returns one all-results matrix, and"split"always returns the linked plot list.
Value
A named list. Single-outcome and combined displays contain
DiagnosticLR, DiagnosticMatrices, DiagnosticLRData, and
DiagnosticMatrixData. Split multi-outcome displays contain Overview,
ByOutcome, DiagnosticMatrices, and their corresponding tidy data.
See also
DiagnosticLikelihoodRatioTable() to calculate displayed LRs.
Examples
data(SampleData)
data(SampleVariableTypes)
df_Labelled <- RevalueData(SampleData, SampleVariableTypes)$RevaluedData
df_Labelled$DiagnosisBinary <- factor(df_Labelled$Diagnosis,
levels = c("Control", "Impaired"))
lr <- DiagnosticLikelihoodRatioTable(df_Labelled, "DiagnosisBinary",
c("sex", "Genotype"))
#> DiagnosisBinary: 'Impaired' treated as outcome-positive.
plots <- PlotDiagnosticLRHeatmap(lr)
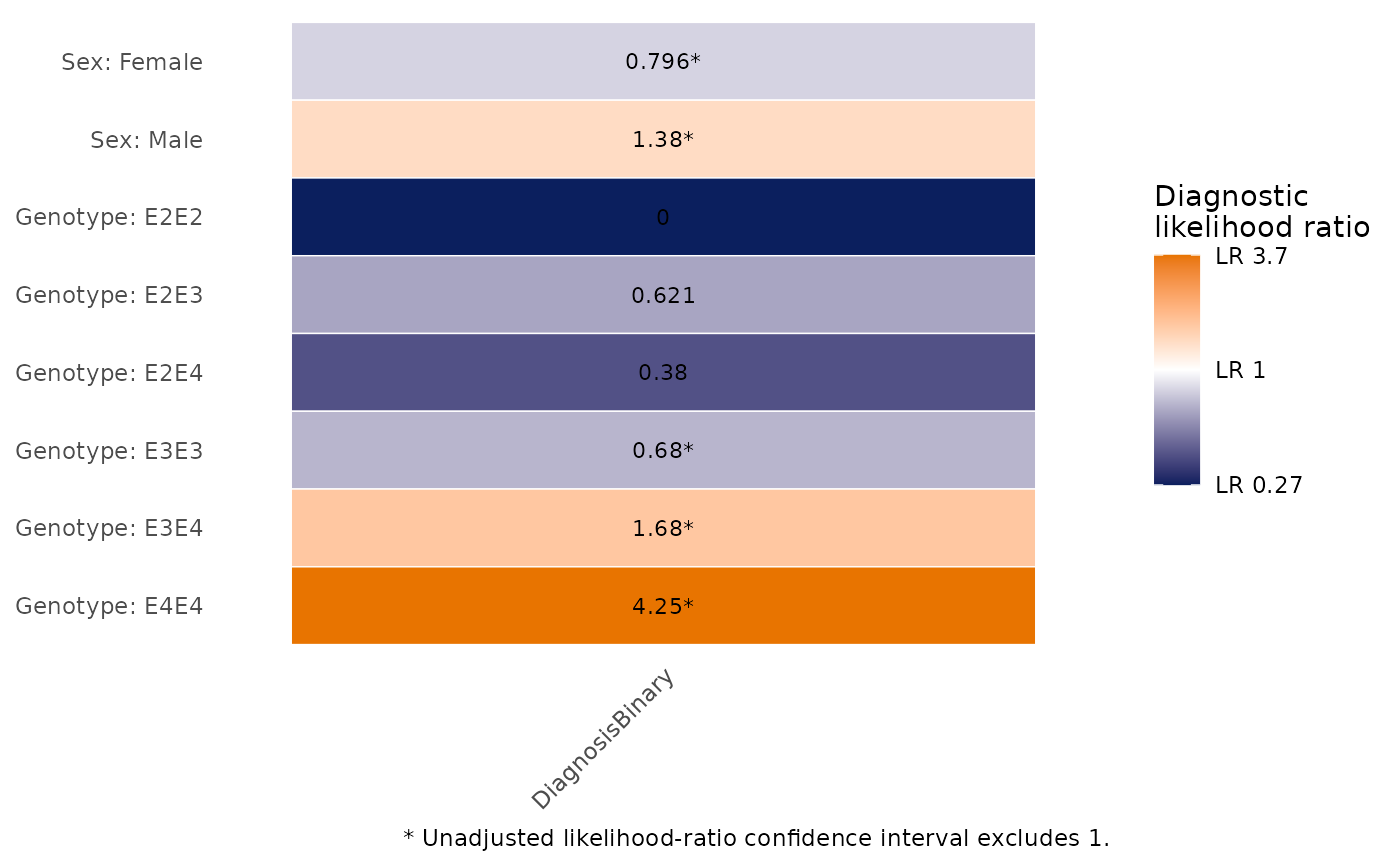
plots$DiagnosticLR
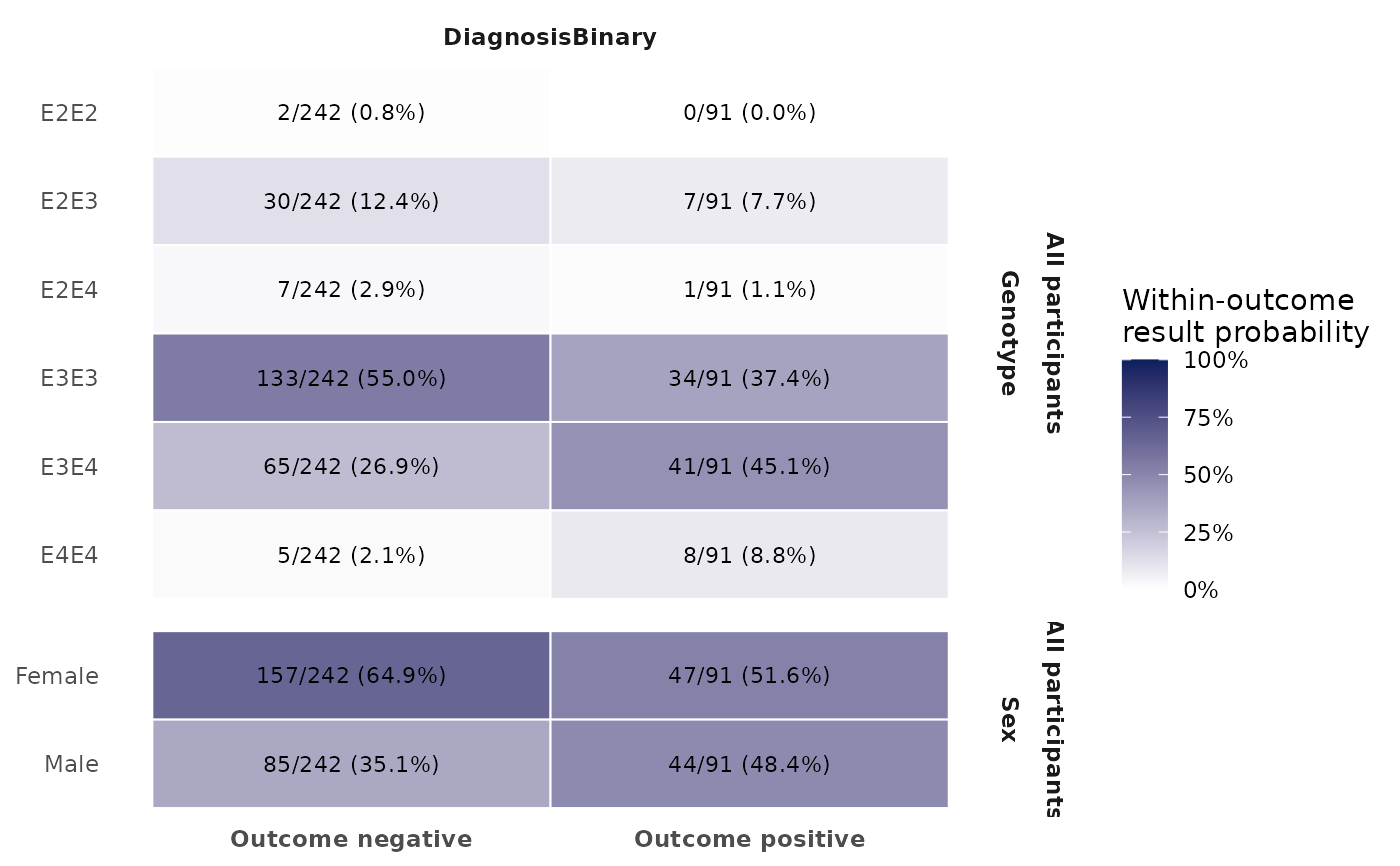
 plots$DiagnosticMatrices