Create diagnostic plots from a ValidateMerge() result object. This function
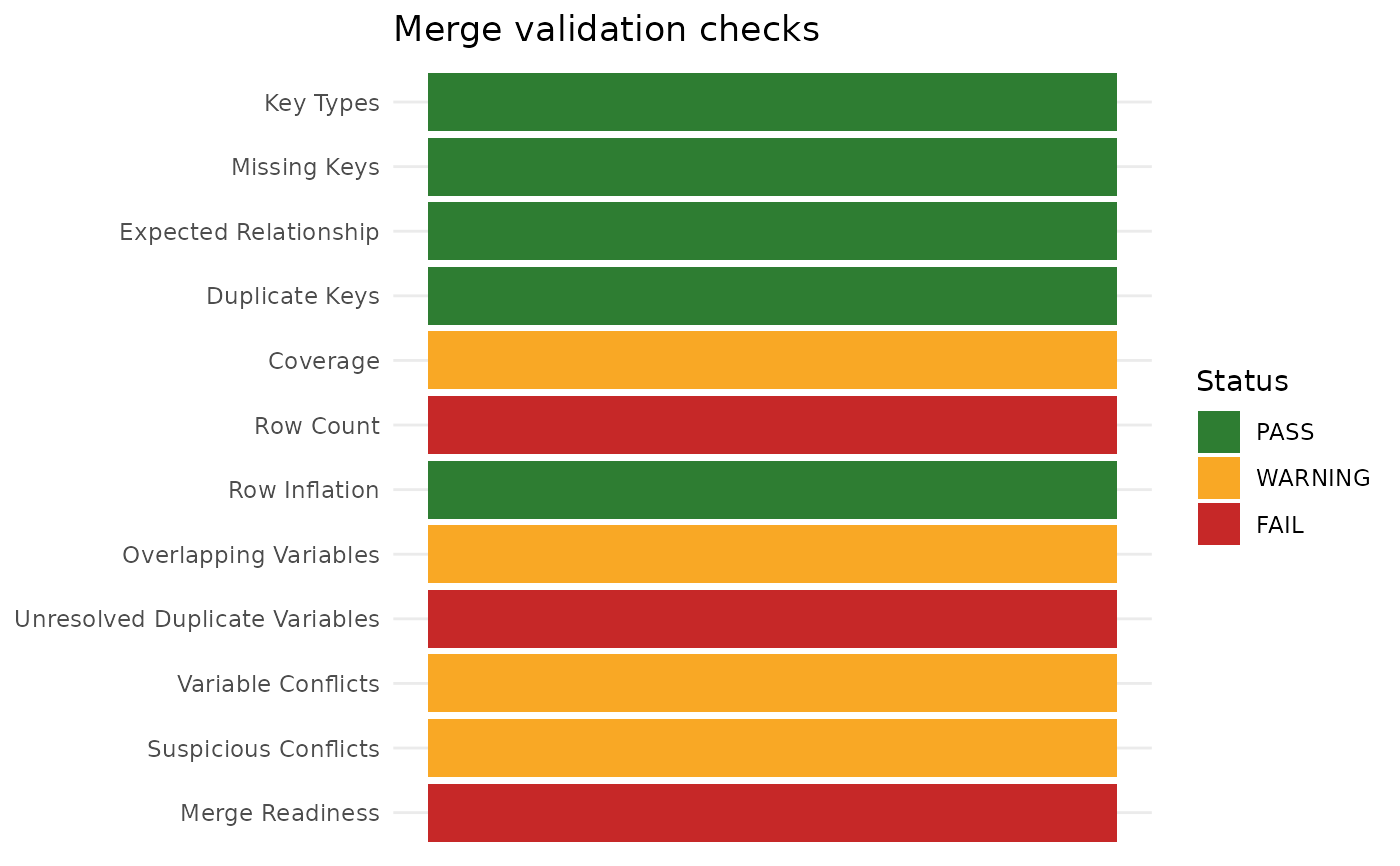
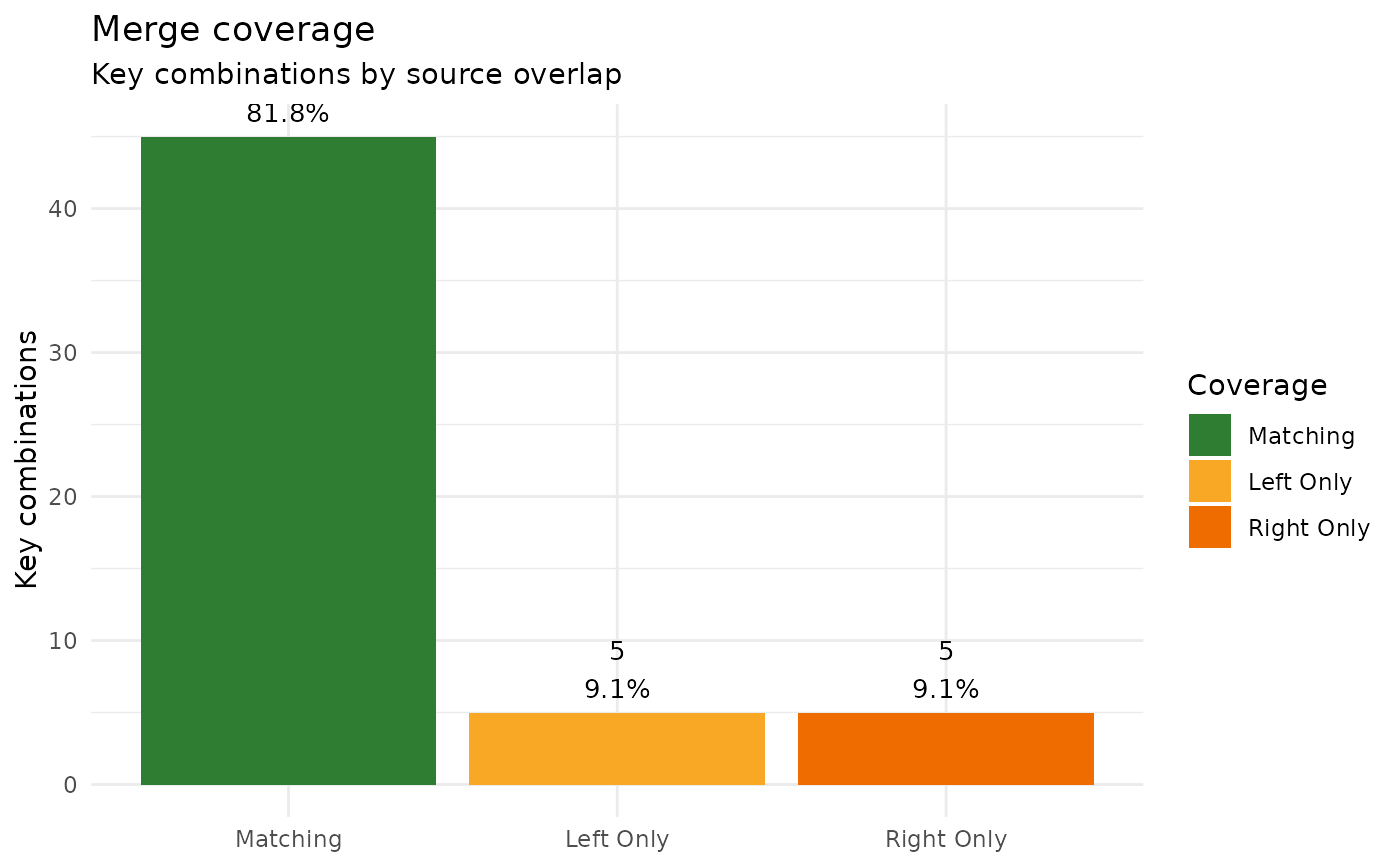
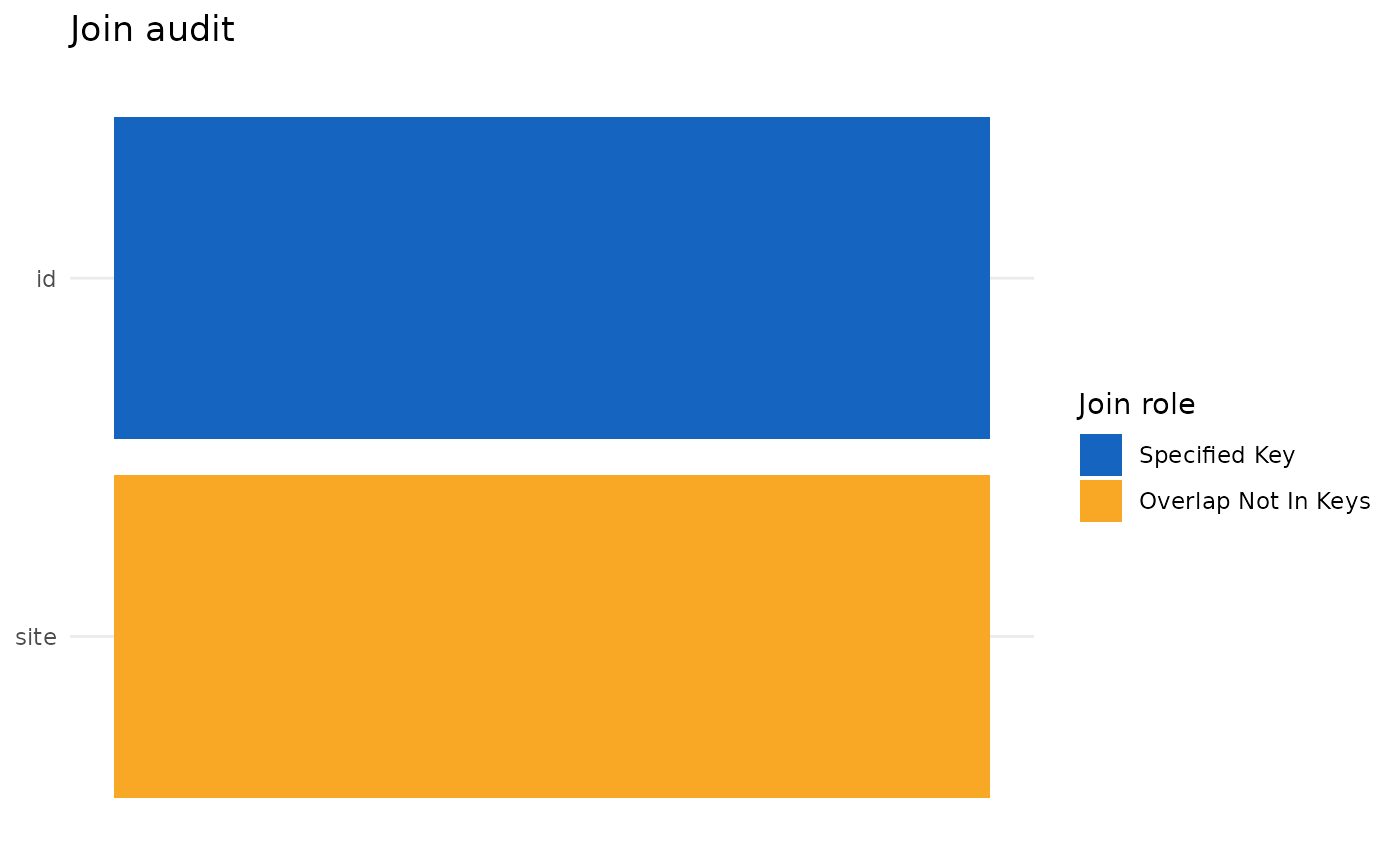
visualizes key merge-audit outputs, including validation check status, key
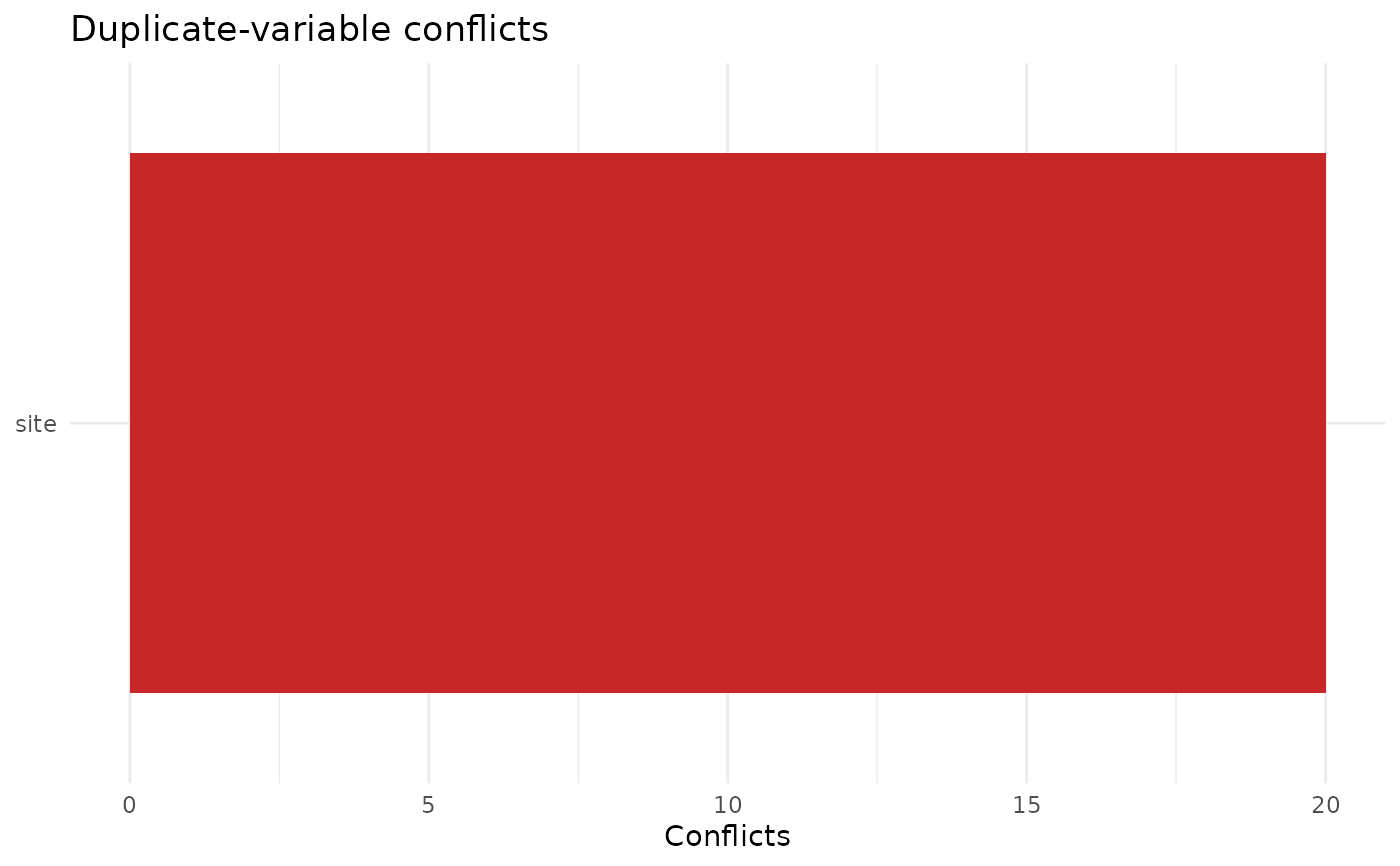
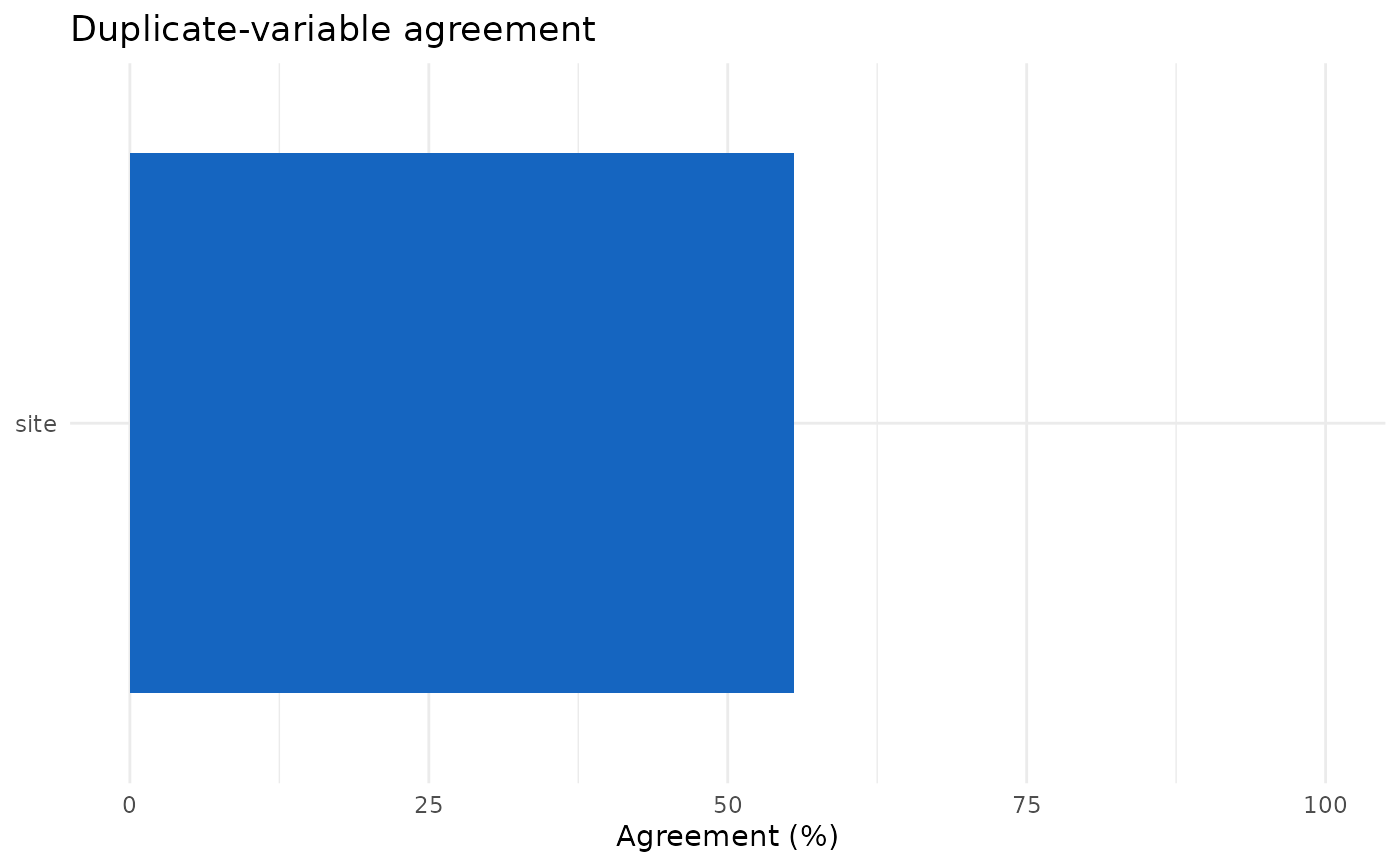
coverage, join-variable auditing, duplicate-variable agreement, and
duplicate-variable conflict counts. Use this after running ValidateMerge()
to quickly inspect whether a merged dataset appears trustworthy.
Usage
PlotMergeValidation(
  MergeObj,
  Plot = c("All", "Checks", "Coverage", "JoinAudit", "Agreement", "Conflicts"),
  interactive = TRUE,
  Interactive = lifecycle::deprecated()
)
Arguments
- MergeObj
A list returned by
ValidateMerge().- Plot
Character value specifying which plot to return. Options are
"All","Checks","Coverage","JoinAudit","Agreement", and"Conflicts". Default is"All".- interactive
Logical; if
TRUE, plots are converted to interactiveplotlyobjects usingplotly::ggplotly(). Default isTRUE.- Interactive
Deprecated (since 19.15.0). Use
interactiveinstead.
Value
If Plot = "All", a named list of plots. Otherwise, a single plot
object. Plot objects are either ggplot objects or plotly htmlwidgets,
depending on Interactive.
Details
The function expects the object returned by ValidateMerge(). It does not
re-run any merge validation checks.
Examples
set.seed(1)
# `site` comes from both sources and disagrees, leaving a site.x/site.y pair
left <- data.frame(
id = 1:50,
site = sample(c("A", "B"), 50, replace = TRUE),
x = rnorm(50)
)
right <- data.frame(
id = c(1:45, 101:105),
site = sample(c("A", "B"), 50, replace = TRUE),
y = rnorm(50)
)
merged <- merge(left, right, by = "id")
validation <- ValidateMerge(left, right, merged, keys = "id")
diagnostics <- PlotMergeValidation(
validation,
Plot = "All",
interactive = FALSE
)
# Merge-check status, key coverage, join audit, agreement, and conflicts
diagnostics$Checks
 diagnostics$Coverage
 diagnostics$JoinAudit
 diagnostics$Agreement
 diagnostics$Conflicts