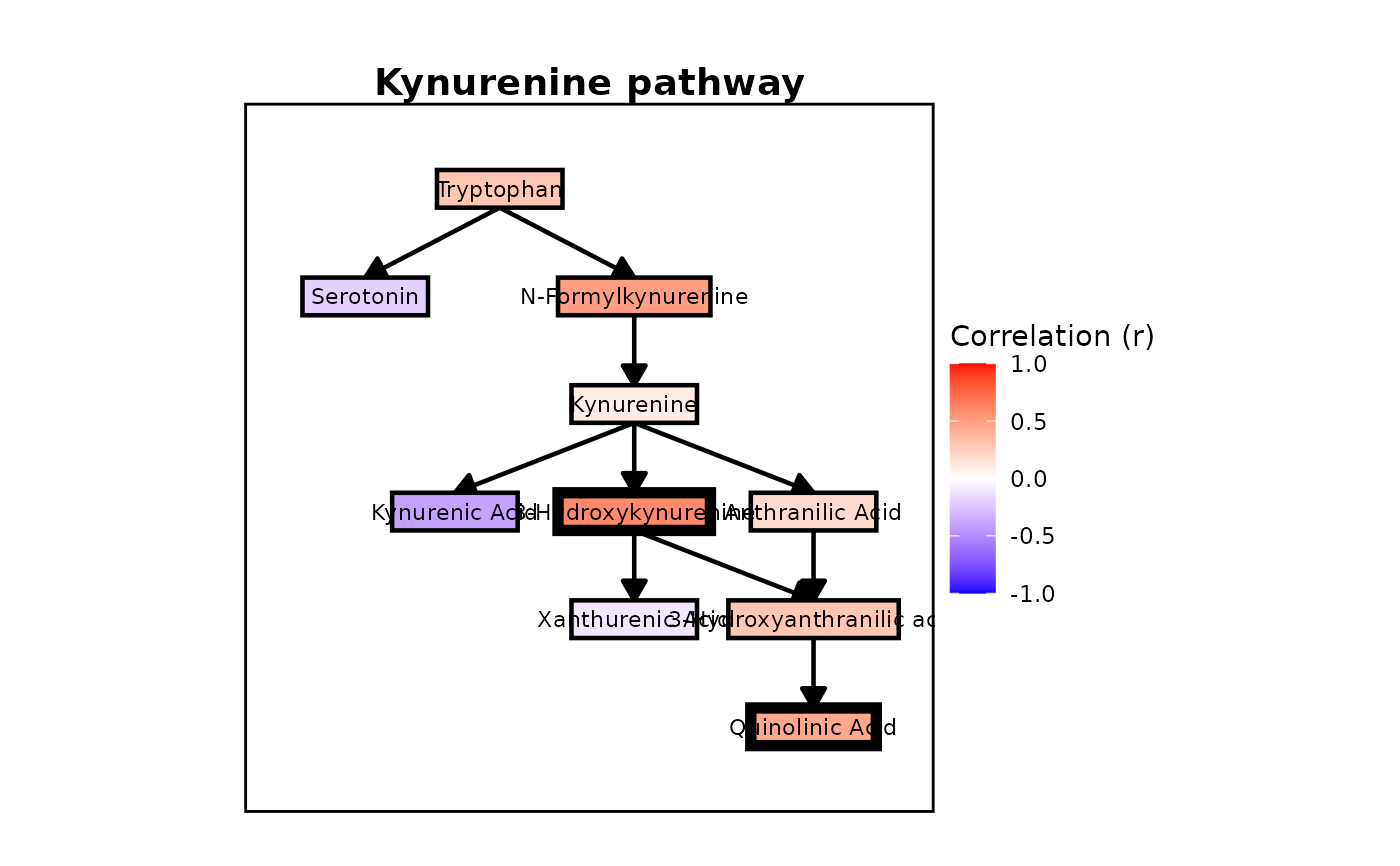
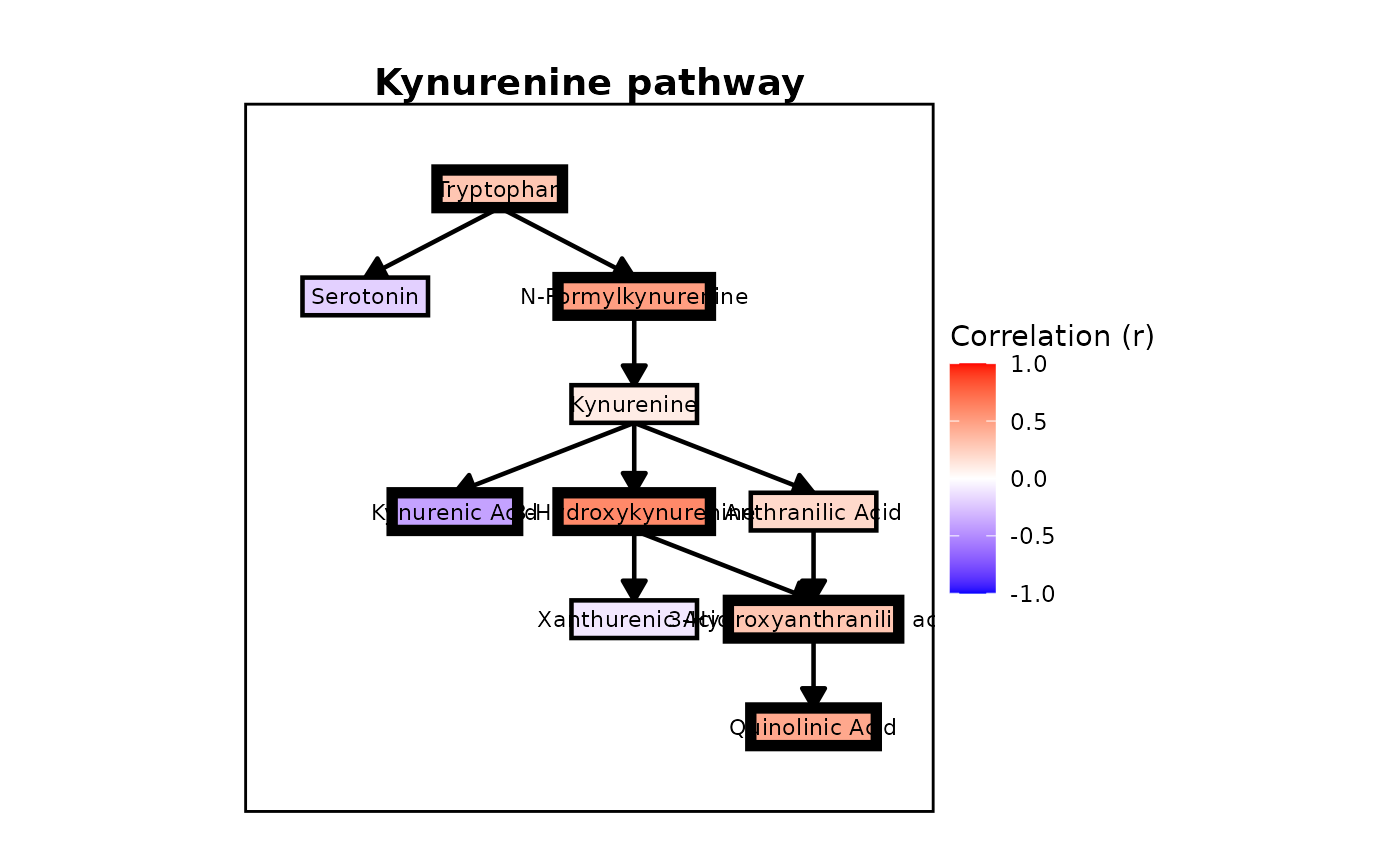
Creates a pathway diagram for the kynurenine-tryptophan metabolic pathway with color-coded fold changes or correlations and significance indicators.
CreatePathwayPlot_KT() has been superseded by
PlotPathway_KT(). It remains available as a backwards-compatible alias
during the pathway plot's planned transition to a metabolomics-focused
package.
Usage
PlotPathway_KT(
  results_table,
  title = "",
  value_type = "auto",
  metabolite_mapping = NULL,
  use_fdr = FALSE
)

CreatePathwayPlot_KT(...)
Arguments
- results_table
Data frame with columns: Metabolite, p_value, p_adj, and either "% Change" or "correlation"
- title
Character string for plot title
- value_type
Character string: "auto", "fold_change", or "correlation"
- metabolite_mapping
Named character vector mapping results table names to standard names. For example: c("N'-Formylkynurenine" = "N-Formylkynurenine", "Quinolinic Acid(log10)" = "Quinolinic Acid")
- use_fdr
Logical: if TRUE uses FDR-adjusted p-values (p_adj) for significance, if FALSE uses raw p-values. Default is FALSE.
- ...
Arguments passed to
PlotPathway_KT().
Details
This KT pathway visualization remains available in SciDataReportR for now, but is expected to move to a future metabolomics-focused package.
Examples
# A results table keyed by kynurenine-pathway metabolite. Real workflows
# build this with calculate_pathway_results(); here it is entered directly.
results <- data.frame(
Metabolite = c(
"Tryptophan", "Serotonin", "N-Formylkynurenine", "Kynurenine",
"Kynurenic Acid", "3-Hydroxykynurenine", "Anthranilic Acid",
"Xanthurenic Acid", "3-Hydroxyanthranilic acid", "Quinolinic Acid"
),
correlation = c(0.30, -0.20, 0.50, 0.10, -0.40, 0.60, 0.20, -0.10, 0.30, 0.45),
p_value = c(0.01, 0.20, 0.03, 0.50, 0.04, 0.001, 0.30, 0.60, 0.02, 0.008),
p_adj = c(0.05, 0.40, 0.10, 0.70, 0.10, 0.01, 0.50, 0.80, 0.08, 0.03)
)
# Basic usage with raw p-values
PlotPathway_KT(results, "Kynurenine pathway")
 # Use FDR-adjusted p-values for significance
PlotPathway_KT(results, "Kynurenine pathway", use_fdr = TRUE)
# Use FDR-adjusted p-values for significance
PlotPathway_KT(results, "Kynurenine pathway", use_fdr = TRUE)