Apply the SciDataReportR qualitative palette to the color aesthetic in a
ggplot. Use this scale for categorical groups represented by points, lines,
outlines, or other color-mapped geometries.
Arguments
- ...
Additional arguments passed to
ggplot2::scale_color_manual().
Examples
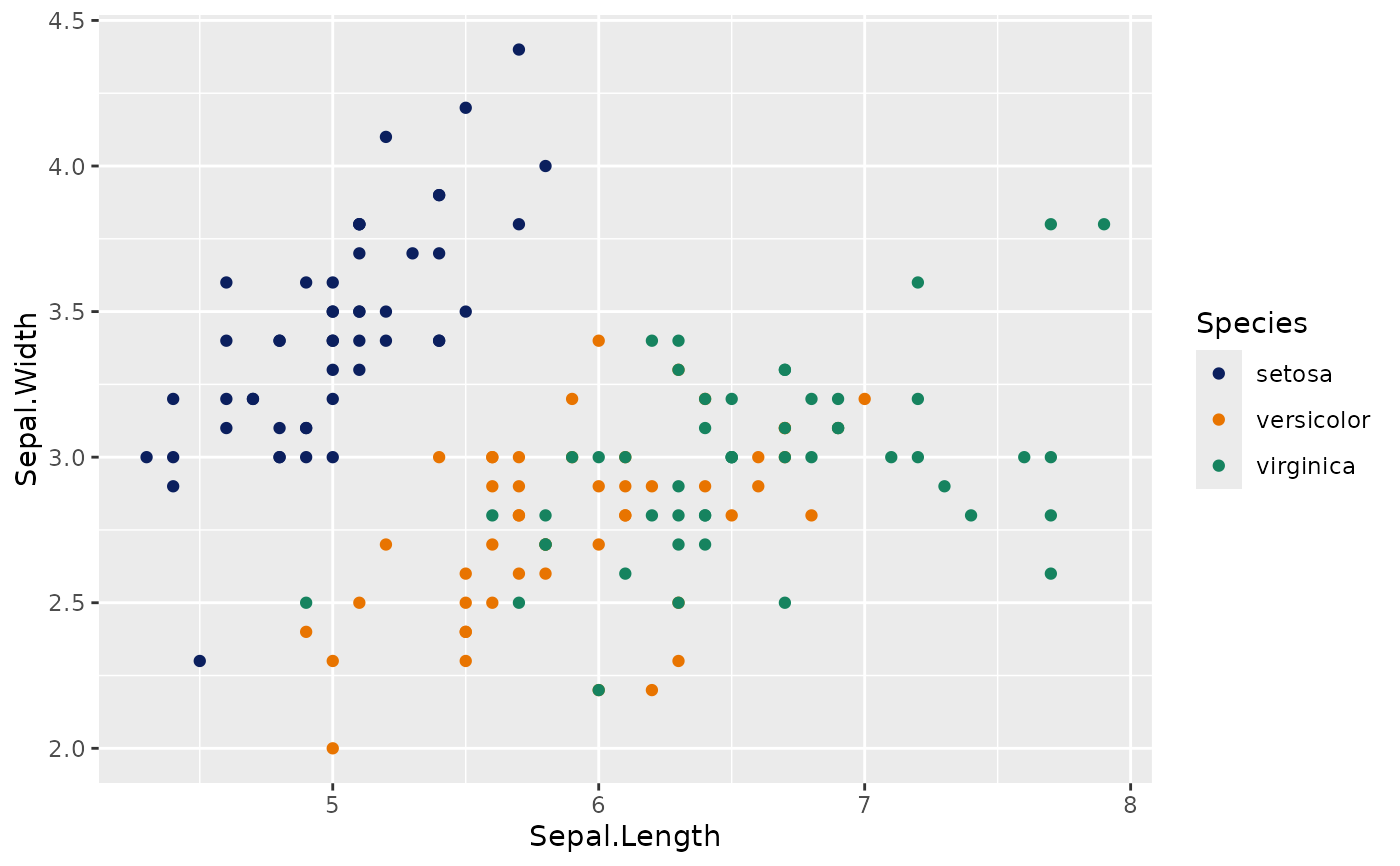
ggplot2::ggplot(
  iris,
  ggplot2::aes(
    x = Sepal.Length,
    y = Sepal.Width,
    color = Species
  )
) +
  ggplot2::geom_point() +
  scale_color_SciData()