
SOM + latent profile clustering pipeline (with AHP and distance baselines)
Source:R/Pipeline_SOMClust.R
CreateClusterModel_SOM_MClust.RdEnd-to-end pipeline to:
Standardize variables using SciDataReportR::CreateZScoreObject() or a supplied Z-score object.
Fit a Self-Organizing Map (SOM; kohonen) on complete cases.
Generate aweSOM visualizations (Circular, Line, Cloud) with optional relabeling using variable labels from the original data frame.
Cluster SOM codebook vectors using latent profile analysis (tidyLPA / mclust backend).
In
method = "exploratory", fit a grid of models and select a recommended solution using an Analytic Hierarchy Process (AHP)-style index combining AIC, BIC, and Entropy.In
method = "finalize", fit a user-specified model and number of profiles.Map node-level clusters and posterior probabilities back to individuals.
Store training variable summaries used later to quantify whether projected cohorts fall outside the original training range.
This supports a train once, project many clinical phenotyping workflow: learn phenotype structure in a training cohort, then project new cohorts into the fixed phenotype space without reclustering.
Ideal use: correlated continuous clinical or biomarker measures where a topology-preserving map is clinically informative before model-based profiles.
Missing data:
SOM and clustering are fit only on rows with complete Z-scores.
The returned
DataWithClustershas exactly the original rows and columns plus canonical-cluster and hard/soft confidence columns; rows not used in SOM/LPA get NA for every assignment diagnostic.The returned
ProbFit$individualis also full length, preserving one row per input row with NA posterior probabilities for rows excluded from SOM/LPA.
Z-score behavior:
ZScoreType = "Center and Scale"/"Center Only"/"Scale Only"computes Z-scores fromdfviaCreateZScoreObject().ZScoreType = "ZScoreObj"projects Z-scores using an externalZScoreObjviaProjectZScore().ZScoreType = "PreZScored"uses existing Z-score columns indfas-is and does not re-zscore.
Readable SOM + Mclust workflow wrapper for
CreateClusterModel_SOM_MClust().
Compatibility wrapper for Pipeline_SOM_MClust().
Deprecated alias for CreateClusterModel_SOM_MClust().
Usage
CreateClusterModel_SOM_MClust(
  data,
  variables = NULL,
  method = c("exploratory", "finalize", "explore"),
  k_range = 2:10,
  models = c(1, 2, 3, 6),
  final_k = NULL,
  final_model = NULL,
  ClusterVariableName = "Cluster",
  ZScoreType = c("Center and Scale", "Center Only", "Scale Only", "ZScoreObj",
    "PreZScored"),
  ZScoreObject = NULL,
  som_xdim = NULL,
  som_ydim = NULL,
  map_from = NULL,
  som_topo = "hexagonal",
  som_neigh = "gaussian",
  node_weighting = c("uniform", "occupancy"),
  assignment = c("soft", "hard"),
  soft_n_nodes = 3L,
  boundary_margin_threshold = 0.2,
  boundary_entropy_threshold = 0.6,
  seed_som = 934521L,
  seed_lpa = 93421L,
  Relabel = TRUE,
  ZScorePrefix = "Z_",
  ZScoreVars = NULL,
  id_var = NULL,
  lpa_progress = FALSE,
  lpa_em_itmax = 100L,
  lpa_em_tol = 1e-05,
  lpa_bootstrap_n = 0L,
  lpa_timeout_seconds = 120,
  lpa_drop_zero_sd = TRUE,
  lpa_zero_sd_tol = 1e-08,
  skip_model_after_n_failures = 2L,
  slow_fit_seconds = 120,
  min_nodes_per_cluster = 5,
  min_nodes_per_parameter = 3,
  min_participants_per_node = 10,
  lpa_min_node_n = 0L,
  min_cluster_prop = NULL,
  criteria_weights = NULL,
  high_dist_quantile = 0.95,
  low_prob_threshold = 0.7,
  stability_resamples = 0L,
  stability_candidates = c("all", "best_per_k"),
  stability_top_n = NULL,
  stability_seed = 934522L,
  stability_fractions = 0.9,
  stability_progress = FALSE,
  stability_cores = NULL,
  df = lifecycle::deprecated(),
  id_col = lifecycle::deprecated(),
  .NodeClusterFn = NULL,
  .CandidatePairs = NULL
)

Pipeline_SOM_MClust(...)

Pipeline_SOMClust(...)

CreateSOMClusterModel(...)
Arguments
- data
Data frame containing the variables to be used in SOM and clustering.
- variables
Optional character vector of variable names. If NULL, numeric variables are auto-detected using
SciDataReportR::getNumVars(df, Ordinal = FALSE). InZScoreType = "PreZScored", this can also be NULL if you supplyZScoreVarsor if Z-score columns can be auto-detected by prefix.- method
One of
"exploratory"(default) or"finalize". In"exploratory", a grid of models is fit and AHP chooses the recommended solution. In"finalize", the user must specifyfinal_kandfinal_model.- k_range
Integer vector of numbers of clusters/profiles to consider in exploratory mode. Default
2:10.- models
Integer vector of model specifications for tidyLPA's mclust backend. Model 1 uses equal variance and zero covariance; model 2 uses varying variance and zero covariance; model 3 uses equal variance and equal covariance; and model 6 uses varying variance and varying covariance. Zero-covariance models assume conditional independence between variables within each cluster. Equal parameters are shared across clusters; varying parameters are cluster-specific. Supported values and the default are
c(1, 2, 3, 6). Models 4 and 5 require OpenMx and are intentionally unsupported.- final_k
Integer; number of profiles for
method = "finalize".- final_model
Integer; model specification for
method = "finalize"(should be one ofmodels).- ClusterVariableName
Name of the cluster column in the output. Defaults to
"Cluster". If this column already exists indf, it is overwritten (with a message).- ZScoreType
One of:
"Center and Scale"(default)"Center Only""Scale Only""ZScoreObj"(use an existing ZScore object)"PreZScored"(use existing Z-score columns in df as-is)
- ZScoreObject
Optional ZScoreObj (from
CreateZScoreObject()orProjectZScore()) to use whenZScoreType = "ZScoreObj".- som_xdim, som_ydim
Optional integers for SOM grid dimensions. If NULL, a square grid is derived from the planned maximum number of profiles: in exploratory fits this is
max(k_range)and in finalized fits it isfinal_k. The engineering default is approximately 20 SOM nodes per planned profile. It retains several local prototypes for each candidate phenotype without letting a larger sample automatically create an increasingly sparse map. The automatic side is also enlarged when needed to providemin_nodes_per_parametercodebook observations per estimated Mclust parameter, but is capped so that it targets at leastmin_participants_per_nodecomplete participants per map node. Sample size therefore informs map health rather than indefinitely increasing map resolution. Explicit dimensions always override this policy.- map_from
Optional exploratory
Pipeline_SOM_MClustobject. In a finalized fit, reuse only its resolved dimensions, topology, neighbourhood, and SOM seed. Clustering-variable names and order must match. Training preprocessing is deliberately recomputed ondata; passZScoreType = "ZScoreObj"to reuse scaling explicitly.- som_topo
SOM topology for
kohonen::somgrid(), default"hexagonal".- som_neigh
SOM neighbourhood function, default
"gaussian".- node_weighting
Whether codebook nodes enter the mixture with equal map-space weight (
"uniform", default) or their training participant occupancy ("occupancy"). Occupancy weighting supports Models 1–3 only.- assignment
Participant phenotype definition:
"hard"maps the Mclust class of the best-matching SOM node;"soft"sums the Mclust node posterior probabilities across nearby codebook nodes and chooses the largest participant-level probability. Both outputs are always retained; the default"soft"controls the canonicalCluster.- soft_n_nodes
Number of nearest codebook nodes used by soft projection. Their inverse-squared standardized-feature distances are normalized to proximity weights. Default
3.- boundary_margin_threshold
Minimum difference between the largest and second-largest soft class probabilities before a participant is flagged as a boundary participant. Default
0.20.- boundary_entropy_threshold
Maximum normalized soft-membership entropy before a participant is flagged as a boundary participant. Default
0.60. A flag is set if either boundary criterion is met.- seed_som, seed_lpa
Integer seeds for SOM and LPA steps (defaults 934521 and 93421).
- Relabel
Logical; if TRUE (default), aweSOM plots are relabeled using variable labels from the original
df(via Hmisc or sjlabelled when available) by stripping the Z-score prefix.- ZScorePrefix
Character prefix used for Z-score columns when
ZScoreType = "PreZScored". Default"Z_".- ZScoreVars
Optional character vector of Z-score column names to use when
ZScoreType = "PreZScored". If NULL, the function attempts to infer them fromvariablesor by detecting columns starting withZScorePrefix.- id_var
Optional character scalar. If provided and present in
df, this column is carried intoProbFit$individualfor convenience.- lpa_progress
Logical; if TRUE, print short progress messages while fitting model/profile combinations.
- lpa_em_itmax
Integer; maximum number of EM iterations passed to
mclust::emControl(). Use NULL to leave mclust defaults unchanged.- lpa_em_tol
Numeric; EM convergence tolerance passed to
mclust::emControl(). Use NULL to leave mclust defaults unchanged.- lpa_bootstrap_n
Bootstrap resamples tidyLPA runs for each candidate fit: a bootstrap likelihood-ratio test (BLRT) against k - 1 profiles and MclustBootstrap. Default
0skips them, which removes most of the fitting time;BLRTStatisticandBLRTPValueare thenNA. Set to, e.g.,100to report the BLRT. Stability refits never run them.- lpa_timeout_seconds
Optional timeout in seconds for individual LPA fits. Use NULL to disable timeouts.
- lpa_drop_zero_sd
Logical; if TRUE, remove SOM code dimensions with near-zero standard deviation before LPA.
- lpa_zero_sd_tol
Numeric tolerance used when
lpa_drop_zero_sd = TRUE.- skip_model_after_n_failures
Optional integer; skip a model family after this many failures.
- slow_fit_seconds
Optional runtime threshold used to flag slow LPA fits in diagnostics.
- min_nodes_per_cluster
Optional minimum average SOM nodes per cluster considered before attempting a candidate profile count.
- min_nodes_per_parameter
Positive target number of codebook nodes per estimated free Gaussian-mixture parameter for automatic maps. Default
3. Mclust is fit to SOM codebooks, so codebook nodes—not cohort rows—are its effective observations. This conservative support floor supplements the 20-nodes-per-planned-profile representation target. Explicit map dimensions are reported but never resized.- min_participants_per_node
Positive target number of complete training participants per SOM node for automatically sized maps. Default
10is an engineering occupancy target, not a universal statistical threshold. It prevents the codebook-support floor from silently producing sparse maps.- lpa_min_node_n
Minimum number of training participants a SOM node must hold to enter the node-level mixture fit. Default
0fits every node. Use1to leave empty nodes out, so unoccupied map regions do not count as observations in AIC/BIC. Nodes left out are classified afterwards by the fitted mixture model, so every node still carries a phenotype and posterior probabilities for projection.- min_cluster_prop
Optional minimum share of training participants (0-1) in a candidate's smallest profile. Candidates below it are marked
Eligible = FALSEin the fit table and are not recommended. Use it to keep only phenotypes large enough to describe and interpret.- criteria_weights
Weights for the composite rank index.
NULL(default) weights the criteria equally. A named non-negative vector over"AIC","BIC","Entropy", and"Reproducibility"sets weights directly. A square reciprocal pairwise-comparison matrix with those row and column names derives Analytic Hierarchy Process weights from its principal eigenvector and reports Saaty's consistency ratio (warning above 0.10)."Reproducibility"requiresstability_resamples > 0.- high_dist_quantile
Numeric value between 0 and 1 used to define high SOM-distance flags from the training distance distribution. Default is
0.95.- low_prob_threshold
Numeric posterior probability threshold used to flag uncertain phenotype membership. Default is
0.70.- stability_resamples
Number of 90% participant subsample refits used to assess reproducibility for every successful exploratory candidate. Subsamples are drawn without replacement and reuse the reference model's resolved SOM grid dimensions and the reference SOM seed. Each refit maps the complete reference cohort before scoring participant assignments. Defaults to
0(disabled); use30for an exploratory stability screen.- stability_candidates
Which candidates receive subsample stability:
"all"(default) or"best_per_k", the highest-ranked candidate (by the composite index without reproducibility, eligible first) at each number of profiles, so stability can inform the choice of k across the whole range. Candidates without stability keepNAreproducibility and are not recommended.- stability_top_n
Optional integer. When supplied, stability is estimated only for the top
stability_top_ncandidates ranked by the composite index without reproducibility (eligible candidates first); the others keepNAstability and are not recommended. Use it to screen a large candidate grid, e.g.stability_top_n = 5.- stability_seed
Integer seed for participant subsampling.
- stability_fractions
Unique participant-retention fractions for an opt-in deletion-stability curve. The default,
0.90, preserves the ordinary 90% refit screen. Each fraction refits the complete pipeline and projects the full reference cohort before all-participant ARI is scored.- stability_progress
Logical; if TRUE, print subsample progress messages.
- stability_cores
Number of workers for stability refits.
NULLuses a conservative estimate based on CPU, refit count, and memory: the smaller of 50% physical RAM and 75% currently available RAM. Explicit values are retained up to the scheduler/CPU limit and warn if their estimated memory exceeds that budget. Each worker holds a refit in memory.- df
Deprecated (since 19.15.0). Use
datainstead.- id_col
Deprecated (since 19.15.0). Use
id_varinstead.- .NodeClusterFn
Internal. A function taking the SOM codebook matrix and returning a list with a
node_clusterinteger vector (one label per SOM node) and, optionally,fit_table,ahp_best_row,recommendation,best_fit_name, andfit_plot. When supplied, the SOM codebook is clustered by that function and the latent-profile grid is not fitted. Used byCreateClusterModel_SOM_HDBSCAN(); not part of the user-facing API.- .CandidatePairs
Internal. A data frame of
ModelandClassespairs restricting the exploratory grid; used by stability refits so each resample fits only the shortlisted candidates.- ...
Arguments passed to
CreateClusterModel_SOM_MClust().
Value
A list of class "Pipeline_SOM_MClust" with components:
method,vars_used,ZScoreType,ZScoreObject,ZScoreVars,ClusterVariableNameDataWithClusters: originaldfwith canonical cluster, hard/soft assignment, soft membership, and boundary diagnostic columns appendedfit_plot: ggplot of AIC/BIC/Entropy/BLRT p-value vs k and model (plus reproducibility when subsample stability is enabled)ModelInfo_SOM: list withsom_model,som_codes,som_grid,training_variable_summary,SOMFit(distance diagnostics, baselines, and per-cluster flags),plots(aweSOM plots)ModelInfo_MClust: list withlpa_models,fit_table,AHPinformation, anddiagnosticsfor LPA warnings, failures, runtimes, and preprocessingModelInfo_MClust$Stability: subsample replicate, cluster recovery, and summary tables whenstability_resamples > 0ProbFit: list withnode(node-level posterior probabilities),individual(full-length per-person mapping and probabilities), and probability plots
Details
ModelInfo_MClust$fit_table uses the fit indices returned by tidyLPA's
mclust backend. AIC, AWE, BIC, CAIC, CLC, KIC, SABIC, and ICL are
likelihood/information criteria, for which lower values are preferred when
comparing candidate fits estimated on the same data. Entropy summarizes
classification separation (higher is better). MinProfileNodeN and
MaxProfileNodeN are integer SOM-node counts in the smallest and largest
profile; the corresponding *Proportion fields divide those counts by the
total number of SOM nodes. BLRTStatistic and BLRTPValue compare a
k-profile model with k - 1 profiles under the same covariance model. A
small p-value supports the added profile's statistical fit, but does not
establish clinical meaning or reproducibility; it is unavailable for k = 1.
The raw BLRTPValue remains in the table. Its candidate-review panel
displays -log10(BLRTPValue) with a dashed 0.05 p-value
reference at -log10(0.05).
Lifecycle settings are intentionally strict: k_range and
models are exploratory-only, while final_k and
final_model are finalize-only. Supplying settings from both modes is
an error, even when an exploratory setting equals its default.
Stability is assessed by refitting the full SOM/LPA pipeline on independent
participant subsamples drawn without replacement, then mapping the
complete reference cohort onto each refit. StabilityARI_Mean is the
primary reproducibility score: the mean adjusted Rand index across these
full-cohort participant partitions. It can be negative when agreement is
worse than chance.
stability_fractions can request an explicit deletion curve; the existing
90% fit-table fields remain the primary review metrics, while
Stability$deletion_curve records every requested retention level.
Co-membership, split/merge, and profile-recovery diagnostics describe
whether instability is localized despite imperfect exact membership; they
never replace all-participant ARI.
StabilityJaccard_Mean is the mean label-matched, per-profile Jaccard
recovery and is retained as a descriptive diagnostic. ReproducibilityScore
equals StabilityARI_Mean; StabilitySuccessRate is reported separately.
Reproducibility_scaled is
the candidate-table min-max rescaling used only by the AHP index and is not
an independently interpretable reproducibility measure.
The composite rank index (stored as ahp_index) is computed by:
Z-scaling AIC, BIC, Entropy, and (when stability is run) reproducibility across candidate solutions (AIC/BIC are negated so that higher scaled scores are preferred).
Taking their weighted mean. Weights are equal unless
criteria_weightssupplies them, either directly or as an Analytic Hierarchy Process pairwise-comparison matrix.Recommending the highest-scoring candidate among those marked
Eligible(seemin_cluster_prop).
The chosen weights, their method, and any consistency ratio are returned in
ModelInfo_MClust$AHP.
MinProfileParticipantN and MinProfileParticipantProportion
give the size of the smallest profile in training participants rather than
SOM nodes.
Phenotypes are learned by Mclust on the SOM codebook. Hard assignment uses
the best-matching node's Mclust class. Soft assignment uses normalized
inverse-squared codebook-distance weights across the nearest nodes to
combine their Mclust posterior probabilities. SoftEntropy is the
normalized entropy of that participant-level probability vector
(entropy divided by log(k)) and SoftMargin is the largest minus
second-largest probability. prob_* columns describe a SOM node's Mclust
posterior, whereas SoftProb_* columns describe a participant's
proximity-weighted membership. Boundary flags are confidence diagnostics
only: they do not remove, relabel, or suppress a participant during
training, stability scoring, or projection.
Each new fit uses one deterministic, seeded full-cohort batch SOM. Its initialization codebook, preprocessing, grid, topology, neighbourhood, epochs, codebooks, and node-level mixture are retained so projection is completely frozen. Earlier fitted objects remain projectable because projection uses their frozen map and mixture rather than refitting either component.
SOM_Distance is the Euclidean distance, in Z-score units, from a
participant to their best-matching unit. Its square is the sum of the
squared per-variable residuals, returned in ModelInfo_SOM$SOMFit$residuals
(Resid_<variable>). ModelInfo_SOM$SOMFit$variable_contribution
summarizes each variable's share of training misfit, and each participant's
largest contributor is recorded in Top_Distance_Variable and
Top_Distance_Share.
LPA model/profile combinations are fit one at a time so that failed or
warning-producing solutions are captured in diagnostics instead of blocking
the entire pipeline. Successful fits are retained and failed fits are listed
in ModelInfo_MClust$diagnostics.
Model review and refinement
Start with ModelInfo_MClust$fit_table, the AHP recommendation, and
fit_plot to compare candidate model specifications and numbers of
profiles. AHP is a useful starting point, not an automatic final decision:
retain solutions whose fit, cluster size, and clinical interpretability are
all reasonable.
The Circular and Line SOM widgets show how the analysis variables vary across
the map; the Cloud widget shows the observations within map cells. Use them
to assess whether the candidate solution represents coherent, interpretable
phenotype patterns. Inspect SOMFit$node_occupancy for empty or sparse
cells, and the SOM-distance plots for clusters with systematically poor map
representation. The posterior-probability plots in ProbFit$plots
identify uncertain node- or individual-level assignments.
If these diagnostics suggest a weak solution, reconsider the variables, SOM
grid dimensions, model family, or candidate k range and refit in
exploratory mode. Once a solution is selected, refit it with
method = "finalize", final_k, and final_model to create
the reusable model for projection.
Set stability_resamples to a positive value to assess internal
reproducibility. Each 90% subsample refits the same candidate SOM/LPA solution
and projects the original participants back into it. Mean adjusted Rand
index summarizes whole-partition agreement; cluster-wise Jaccard recovery
identifies phenotypes that dissolve despite good overall agreement. This is
internal reproducibility, not independent-cohort validation.
Reviewing the candidates
Exploratory mode fits every combination of k and model family, so the
comparison is made once, on one table, rather than by refitting by hand.
ModelInfo_MClust$fit_table holds every candidate solution with its
information criteria, entropy, subsample reproducibility, and the combined
AHP index side by side.
A candidate missing from that table is never a mystery:
ModelInfo_MClust$diagnostics$lpa_fit_diagnostics records each fit's
status, runtime, warnings, and errors, so model families that fail to
converge or exceed the fit timeout show up there.
Once a solution is chosen, refit it on its own with method = "finalize" to
get the reusable, projectable model.
Stability output
Stability assesses internal reproducibility by full-pipeline 90% participant
subsampling without replacement. For each replicate, 90% of complete
participants are selected once, all preprocessing, any reduction (PCA,
MCA, or SOM), and the selected clustering method are refit. Most pipelines
compare assignments for sampled participants. SOM + Mclust instead maps the
complete reference cohort onto every refit and compares the resulting full
participant partition. Stability$settings$comparison_scope records the
policy used. It is an internal sensitivity analysis, not
independent-cohort validation.
Stability$settings records the analysis provenance:
resamples: requested number of 90% subsample refits.seed: seed used to derive reproducible sampling and model seeds.refit_scope: whether agreement is calculated directly in the refitted sample or after refit projection onto the reference cohort.comparison_scope: the participants entering replicate agreement metrics; most pipelines use"sampled_participants", while SOM + Mclust uses"all_reference_participants".resample_type:"subsample_without_replacement"for the primary stability analysis.resample_fraction: the retained participant fraction,0.90.resample_fractions: every requested retention fraction. The default is0.90; additional values create an opt-in deletion-stability curve without replacing the 90% primary screen.coassignment_limit: maximum number of complete training participants (2,000) for which the full pairwise co-assignment matrix is calculated.noise_policy: whether the method has noise labels. For ordinary methods it is"all clusters included"; HDBSCAN variants retain noise in ARI but exclude it from phenotype-level Jaccard recovery.requested_cores,resolved_cores, andworker_policy: the requested and resolved refit workers and the reason for the resolution. Automatic resolution is capped by CPU, refit count, and the smaller of 50% physical RAM and 75% currently available RAM. Pairwise-memory methods are run serially automatically.estimated_bytes_per_worker,estimated_total_bytes,physical_memory_bytes,available_memory_bytes, andsafe_memory_budget_bytes: the conservative memory audit used to resolve automatic workers. An explicit worker request is preserved (within the CPU/scheduler cap) but warns if it exceeds the estimated safe budget.
Stability$replicates has one row per requested refit. Model and
Classes identify the selected candidate (for HDBSCAN, Classes is the
data-derived extracted count); Replicate is its sequence number; Status
is "success" or a failure status; SamplingSeed and ModelSeed identify
the participant draw and refit initialization policy; and Error
contains the error message for an unsuccessful refit. ARI is the primary
successful-refit metric: it is invariant to cluster numbering, higher is
better, and it can be negative when agreement is worse than chance.
Stability$cluster_recovery has one row for each reference Cluster in
each successful Replicate. Jaccard is the recovery of that reference
cluster after matching it to the subsample cluster with the largest Jaccard
overlap; higher is better and one is exact recovery. Model and Classes
again identify the fitted candidate.
Stability$summary combines successful subsample refits:
StabilitySuccessRate is successful refits divided by requested refits, an
operational reliability measure that does not enter the reproducibility
score. StabilityARI_Mean and StabilityARI_P05 are the mean and fifth
percentile of ARI. StabilityJaccard_Mean and StabilityJaccard_Min are
respectively the mean cluster-level recovery and the minimum of the
cluster-specific mean recoveries across replicates.
ReproducibilityScore does not include success rate. For most pipelines it
is the mean of finite StabilityARI_Mean and StabilityJaccard_Mean
values; SOM + Mclust uses StabilityARI_Mean directly because it selects
on agreement of the final participant partition.
SOM + Mclust additionally returns StabilityARI_NonBoundary,
StabilityARI_NonBoundary_P05, and non-boundary Jaccard summaries. These
are secondary diagnostics calculated only on the fixed reference-model mask
with SoftMargin below its threshold or SoftEntropy above its threshold
excluded. The primary all-participant ARI always retains these boundary
participants. boundary_summary reports their count and proportion overall
and within each reference cluster. Earlier posterior-based Core fields are
retained for compatibility as descriptive diagnostics; they are not the
boundary-aware sensitivity measure.
Stability$failures repeats the replicate columns for unsuccessful refits,
making fit failures auditable without mixing them with successful metrics.
Stability$participant_inclusion is one row per complete reference
participant. .row_id identifies the merge-safe input row, Cluster its
reference assignment, SuccessfulRefits the number of usable refits, and
InclusionProbability the proportion of those refits in which the
participant returned to that cluster's label-matched subsample cluster.
Model and Classes identify the candidate. Higher inclusion is better.
Stability$cluster_inclusion summarizes inclusion within each reference
Cluster: MeanInclusion, P05Inclusion, and MinInclusion are the mean,
fifth percentile, and minimum participant inclusion probabilities; Model
and Classes identify the candidate. Higher values indicate that all, not
only the average, of a cluster is recovered consistently.
Stability$coassignment is available only when the complete training cohort
has at most coassignment_limit participants. Each candidate entry has a
status of "available", "skipped", or "not_available"; reason
explains a non-available result; matrix is the pairwise probability that
two complete reference participants are assigned together across successful
subsample refits; and .row_id maps matrix rows and columns to the same
identifiers returned in DataWithClusters and ProbFit$individual. Higher
matrix values mean more consistent pairwise co-membership.
Where more than one candidate is summarized, entries are named by its
Model_Classes key. The matrix is diagnostic only and is never used for
selection.
SOM + Mclust additionally returns memory-safe final-partition diagnostics
for every cohort size. co_membership_by_cluster reports the proportion of
within-reference-cluster participant pairs retained together (Cohesion) and
the probability of co-assignment with outsiders (CrossMixing).
co_membership_between_clusters reports cross-reference-cluster
co-assignment probabilities. split_merge_reference and
split_merge_refit identify dominant sources, shares, and effective numbers
of groups, while profile_recovery reports matched-cluster correlation and
RMSE for mean clustering-variable profiles on the frozen reference scale.
These explain the nature of membership changes; they do not supersede ARI.
deletion_curve summarizes ARI, VI, NMI, and Fowlkes–Mallows agreement at
each requested participant-retention fraction. It is useful for describing
sensitivity to increasing cohort perturbation, not for selecting the least
demanding fraction.
Stability$plots contains cluster_recovery (per-cluster Jaccard),
partition_metrics (the ARI distribution), and
cluster_inclusion; it also contains a co-assignment heatmap when the
matrix is available. These diagnostics complement rather than replace ARI
and Jaccard: none can turn a poorly reproducible cluster into a stable
phenotype.
Metric sources: Hubert and Arabie (1985) define ARI; Jaccard (1901) defines the overlap coefficient; and Monti et al. (2003) describe resampling-based consensus co-assignment.
References
Saaty TL. The Analytic Hierarchy Process. McGraw-Hill, 1980. Kohonen T. Self-organized formation of topologically correct feature maps. Biological Cybernetics. 1982;43:59-69. Scrucca L, Fop M, Murphy TB, Raftery AE. mclust 5. J Stat Softw. 2016;71(11):1-29. Celeux G, Soromenho G. An entropy criterion for assessing the number of clusters in a mixture model. J Classification. 1996;13:195-212. Cavanaugh JE. A large-sample model selection criterion based on Kullback's symmetric divergence. Stat Methodol. 1999;61:165-180. Sclove SL. Application of model-selection criteria to some problems in multivariate analysis. Psychometrika. 1987;52:333-343. Nylund KL, Asparouhov T, Muthen BO. Deciding on the number of classes in latent class analysis and growth mixture modeling. Struct Equ Modeling. 2007;14:535-569. Akogul S, Erisoglu M. An approach for determining the number of clusters in a model-based cluster analysis. Entropy. 2017;19:452.
Examples
# \donttest{
data("SimulatedPhenotypeData")
df_Training <- dplyr::filter(SimulatedPhenotypeData, .data$Cohort == "Training")
vars_Numeric <- paste0("Var", 1:12)
# Example-only display helper (not exported by SciDataReportR): round the
# numeric columns and add a frozen header.
ShowFitTable <- function(x, height = "320px") {
x <- dplyr::mutate(
dplyr::as_tibble(x),
dplyr::across(dplyr::where(is.numeric), \(v) round(v, 3))
)
htmltools::browsable(htmltools::HTML(as.character(
FreezeTableHeader(x, height = height, full_width = TRUE)
)))
}
# Exploratory mode: every combination of k and model family. Model 2 is
# omitted here because it is the slowest to fit and, on this data, reaches
# the fit timeout at every k without contributing a candidate.
review <- CreateClusterModel_SOM_MClust(
data = df_Training,
variables = vars_Numeric,
method = "exploratory",
k_range = 2:5,
models = c(1, 3),
som_xdim = 5,
som_ydim = 5,
stability_resamples = 2,
stability_seed = 20260805,
Relabel = FALSE,
min_nodes_per_cluster = NULL
)
#> Warning: Explicit SOM dimensions do not meet one or more requested mixture-support or participant-occupancy targets; diagnostics are retained for review.
#> Warning: The following SOM mixture candidates have fewer mixture nodes than free parameters and are ineligible for recommendation: Model 1, k = 2; Model 3, k = 2; Model 1, k = 3; Model 3, k = 3; Model 1, k = 4; Model 3, k = 4; Model 1, k = 5; Model 3, k = 5
#> Warning: No candidate is eligible for the composite recommendation; an internal fallback is retained only to construct the review object.
# Every candidate solution
ShowFitTable(review$ModelInfo_MClust$fit_table)
Model
Classes
LogLik
parameters
n
AIC
AWE
BIC
CAIC
CLC
KIC
SABIC
ICL
Entropy
prob_min
prob_max
BLRTStatistic
BLRTPValue
MinProfileNodeN
MaxProfileNodeN
MinProfileNodeProportion
MaxProfileNodeProportion
MinProfileParticipantN
MinProfileParticipantProportion
PosteriorMean
PosteriorMedian
PropLowPosterior
StabilitySuccessRate
StabilityARI_Mean
StabilityARI_P05
StabilityJaccard_Mean
StabilityJaccard_Min
StabilityCoreProportion
StabilityARI_Core
StabilityJaccard_CoreMean
StabilityJaccard_CoreMin
StabilityNonBoundaryProportion
StabilityARI_NonBoundary
StabilityARI_NonBoundary_P05
StabilityJaccard_NonBoundaryMean
StabilityJaccard_NonBoundaryMin
ReproducibilityScore_All
ReproducibilityScore
BoundaryParticipantProportion
MaxClusterBoundaryProportion
MixtureParameters
MixtureNodes
ParticipantsPerNode
OccupancyCompliant
NodesPerParameter
Overparameterized
SupportStatus
AIC_scaled
BIC_scaled
Entropy_scaled
Reproducibility_scaled
Posterior_scaled
ahp_index
Eligible
Recommended
GridDesignPolicy
GridDesignK
TargetNodesPerProfile
SOMNodeCount
ExpectedNodesPerProfile
1
2
-351.068
37
25
776.136
1049.407
821.234
858.234
704.062
816.136
706.494
-821.885
0.963
0.955
1
NA
NA
6
19
0.24
0.76
80
0.250
1
1
0
1
-0.069
-0.069
0.417
0.333
1
-0.069
0.417
0.333
1.000
-0.069
-0.069
0.417
0.333
-0.069
-0.069
0.000
0.0
37
25
12.8
TRUE
0.676
TRUE
over-parameterized
-1.682
-1.852
-2.472
-1.417
-2.475
-1.856
FALSE
FALSE
explicit_dimensions
5
20
25
12.500
3
2
72.513
169
25
192.974
1447.954
398.964
567.964
-143.026
364.974
-125.121
-398.964
1.000
1.000
1
NA
NA
6
19
0.24
0.76
80
0.250
1
1
0
1
-0.069
-0.069
0.417
0.333
1
-0.069
0.417
0.333
1.000
-0.069
-0.069
0.417
0.333
-0.069
-0.069
0.000
0.0
103
25
12.8
TRUE
0.243
TRUE
over-parameterized
0.710
0.705
0.373
-1.417
0.358
0.092
FALSE
FALSE
explicit_dimensions
5
20
25
12.500
1
3
-277.860
50
25
655.719
1025.610
716.663
766.663
557.715
708.719
561.608
-716.678
0.998
0.999
1
NA
NA
6
13
0.24
0.52
80
0.250
1
1
0
1
0.464
0.464
0.667
0.500
1
0.464
0.667
0.500
1.000
0.464
0.464
0.667
0.500
0.464
0.464
0.000
0.0
50
25
12.8
TRUE
0.500
TRUE
over-parameterized
-1.188
-1.219
0.237
-0.259
0.358
-0.607
FALSE
FALSE
explicit_dimensions
5
20
25
8.333
3
3
93.077
182
25
177.846
1529.517
399.682
581.682
-184.154
362.846
-164.717
-399.682
1.000
1.000
1
NA
NA
6
13
0.24
0.52
80
0.250
1
1
0
1
0.464
0.464
0.667
0.500
1
0.464
0.667
0.500
1.000
0.464
0.464
0.667
0.500
0.464
0.464
0.000
0.0
116
25
12.8
TRUE
0.216
TRUE
over-parameterized
0.772
0.700
0.373
-0.259
0.358
0.396
FALSE
FALSE
explicit_dimensions
5
20
25
8.333
1
4
-152.908
63
25
431.816
898.395
508.605
571.605
307.816
497.816
313.237
-508.605
1.000
1.000
1
NA
NA
5
8
0.20
0.32
80
0.250
1
1
0
1
1.000
1.000
1.000
1.000
1
1.000
1.000
1.000
1.000
1.000
1.000
1.000
1.000
1.000
1.000
0.000
0.0
63
25
12.8
TRUE
0.397
TRUE
over-parameterized
-0.270
0.041
0.373
0.907
0.358
0.263
FALSE
FALSE
explicit_dimensions
5
20
25
6.250
3
4
121.189
195
25
147.623
1595.984
385.304
580.304
-240.377
345.623
-219.410
-385.304
1.000
1.000
1
NA
NA
5
8
0.20
0.32
80
0.250
1
1
0
1
1.000
1.000
1.000
1.000
1
1.000
1.000
1.000
1.000
1.000
1.000
1.000
1.000
1.000
1.000
0.000
0.0
129
25
12.8
TRUE
0.194
TRUE
over-parameterized
0.896
0.787
0.373
0.907
0.358
0.741
FALSE
FALSE
explicit_dimensions
5
20
25
6.250
1
5
-121.232
76
25
394.464
957.733
487.099
563.099
244.464
473.464
251.415
-487.099
1.000
1.000
1
NA
NA
2
6
0.08
0.24
0
0.000
1
1
0
1
0.981
0.976
0.986
0.956
1
0.981
0.986
0.956
1.000
0.981
0.976
0.986
0.956
0.981
0.981
0.000
0.0
76
25
12.8
TRUE
0.329
TRUE
over-parameterized
-0.117
0.171
0.373
0.867
0.358
0.323
FALSE
FALSE
explicit_dimensions
5
20
25
5.000
3
5
132.176
208
25
151.648
1696.700
405.174
613.174
-262.352
362.648
-239.853
-405.174
1.000
1.000
1
NA
NA
4
6
0.16
0.24
30
0.094
1
1
0
1
0.892
0.865
0.770
0.250
1
0.892
0.770
0.250
0.963
0.907
0.878
0.770
0.235
0.892
0.892
0.038
0.2
142
25
12.8
TRUE
0.176
TRUE
over-parameterized
0.879
0.667
0.372
0.672
0.326
0.648
FALSE
FALSE
explicit_dimensions
5
20
25
5.000
# Status, runtime, warnings, and errors for every attempted fit
ShowFitTable(
review$ModelInfo_MClust$diagnostics$lpa_fit_diagnostics,
height = "260px"
)
Model
Classes
status
runtime_seconds
slow_fit
n_warnings
warnings
error
1
2
success
0.027
FALSE
0
NA
3
2
success
0.026
FALSE
0
NA
1
3
success
0.028
FALSE
0
NA
3
3
success
0.029
FALSE
0
NA
1
4
success
0.031
FALSE
0
NA
3
4
success
0.033
FALSE
0
NA
1
5
success
0.043
FALSE
0
NA
3
5
success
0.037
FALSE
0
NA
review$ModelInfo_MClust$AHP$recommendation
#> [1] "No eligible SOM mixture candidate is available for composite recommendation."
ShowFitTable(review$Stability$summary, height = "260px")
Model
Classes
StabilitySuccessRate
StabilityARI_Mean
StabilityARI_P05
StabilityJaccard_Mean
StabilityJaccard_Min
StabilityCoreProportion
StabilityARI_Core
StabilityJaccard_CoreMean
StabilityJaccard_CoreMin
StabilityNonBoundaryProportion
StabilityARI_NonBoundary
StabilityARI_NonBoundary_P05
StabilityJaccard_NonBoundaryMean
StabilityJaccard_NonBoundaryMin
ReproducibilityScore_All
ReproducibilityScore
1
2
1
-0.069
-0.069
0.417
0.333
1
-0.069
0.417
0.333
1.000
-0.069
-0.069
0.417
0.333
-0.069
-0.069
3
2
1
-0.069
-0.069
0.417
0.333
1
-0.069
0.417
0.333
1.000
-0.069
-0.069
0.417
0.333
-0.069
-0.069
1
3
1
0.464
0.464
0.667
0.500
1
0.464
0.667
0.500
1.000
0.464
0.464
0.667
0.500
0.464
0.464
3
3
1
0.464
0.464
0.667
0.500
1
0.464
0.667
0.500
1.000
0.464
0.464
0.667
0.500
0.464
0.464
1
4
1
1.000
1.000
1.000
1.000
1
1.000
1.000
1.000
1.000
1.000
1.000
1.000
1.000
1.000
1.000
3
4
1
1.000
1.000
1.000
1.000
1
1.000
1.000
1.000
1.000
1.000
1.000
1.000
1.000
1.000
1.000
1
5
1
0.981
0.976
0.986
0.956
1
0.981
0.986
0.956
1.000
0.981
0.976
0.986
0.956
0.981
0.981
3
5
1
0.892
0.865
0.770
0.250
1
0.892
0.770
0.250
0.963
0.907
0.878
0.770
0.235
0.892
0.892
review$fit_plot
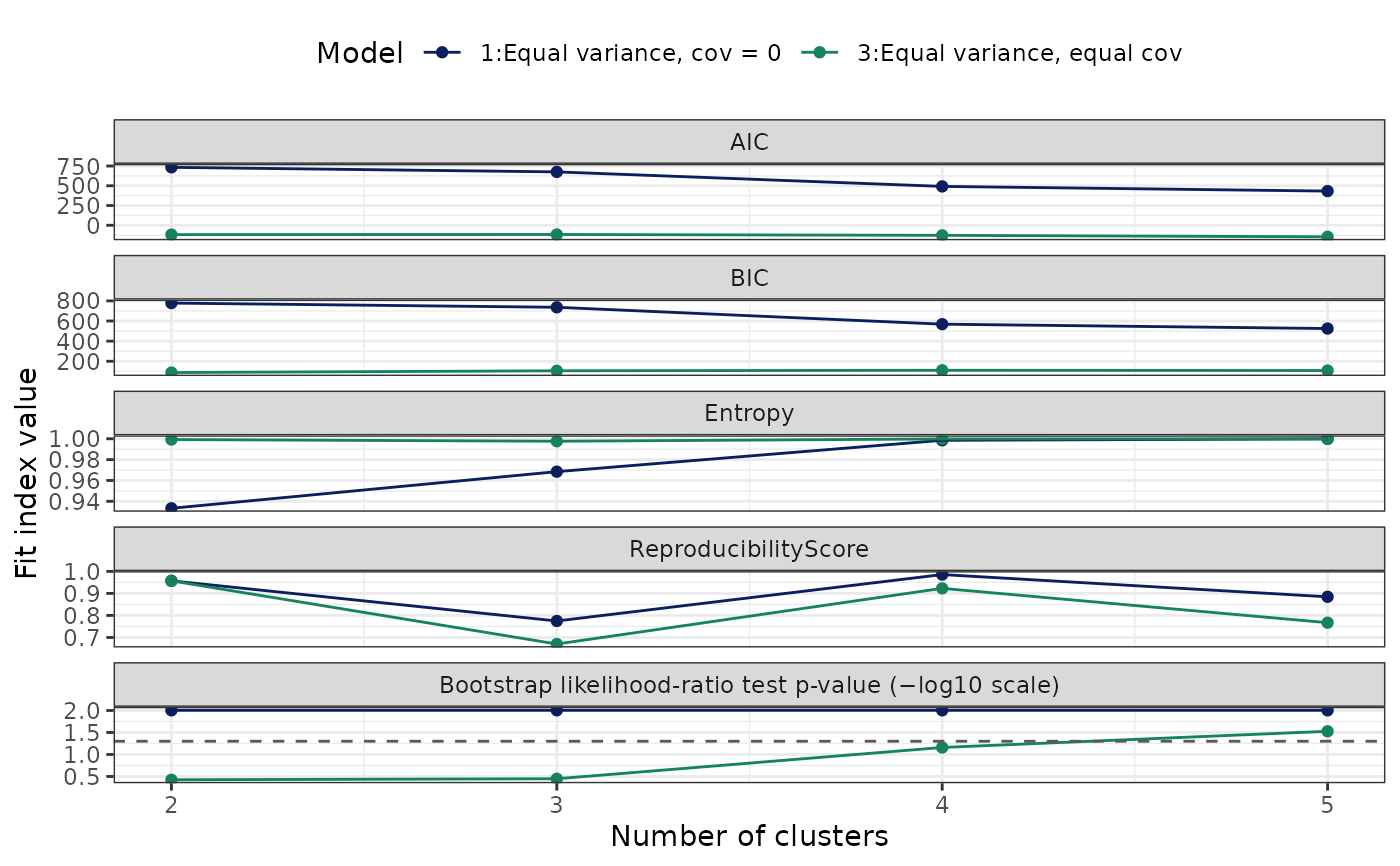 review$fit_plot
 # Refit the chosen solution to get the projectable model
model <- CreateClusterModel_SOM_MClust(
data = df_Training, variables = vars_Numeric, method = "finalize",
final_k = 4, final_model = 1, som_xdim = 5, som_ydim = 5,
stability_resamples = 2, Relabel = FALSE,
min_nodes_per_cluster = NULL
)
#> Warning: Explicit SOM dimensions do not meet one or more requested mixture-support or participant-occupancy targets; diagnostics are retained for review.
#> Warning: The following SOM mixture candidates have fewer mixture nodes than free parameters and are ineligible for recommendation: Model 1, k = 4
#> Warning: No candidate is eligible for the composite recommendation; an internal fallback is retained only to construct the review object.
ShowFitTable(model$ModelInfo_MClust$fit_table, height = "160px")
# Refit the chosen solution to get the projectable model
model <- CreateClusterModel_SOM_MClust(
data = df_Training, variables = vars_Numeric, method = "finalize",
final_k = 4, final_model = 1, som_xdim = 5, som_ydim = 5,
stability_resamples = 2, Relabel = FALSE,
min_nodes_per_cluster = NULL
)
#> Warning: Explicit SOM dimensions do not meet one or more requested mixture-support or participant-occupancy targets; diagnostics are retained for review.
#> Warning: The following SOM mixture candidates have fewer mixture nodes than free parameters and are ineligible for recommendation: Model 1, k = 4
#> Warning: No candidate is eligible for the composite recommendation; an internal fallback is retained only to construct the review object.
ShowFitTable(model$ModelInfo_MClust$fit_table, height = "160px")
Model
Classes
LogLik
parameters
n
AIC
AWE
BIC
CAIC
CLC
KIC
SABIC
ICL
Entropy
prob_min
prob_max
BLRTStatistic
BLRTPValue
MinProfileNodeN
MaxProfileNodeN
MinProfileNodeProportion
MaxProfileNodeProportion
MinProfileParticipantN
MinProfileParticipantProportion
PosteriorMean
PosteriorMedian
PropLowPosterior
StabilitySuccessRate
StabilityARI_Mean
StabilityARI_P05
StabilityJaccard_Mean
StabilityJaccard_Min
StabilityCoreProportion
StabilityARI_Core
StabilityJaccard_CoreMean
StabilityJaccard_CoreMin
StabilityNonBoundaryProportion
StabilityARI_NonBoundary
StabilityARI_NonBoundary_P05
StabilityJaccard_NonBoundaryMean
StabilityJaccard_NonBoundaryMin
ReproducibilityScore_All
ReproducibilityScore
BoundaryParticipantProportion
MaxClusterBoundaryProportion
MixtureParameters
MixtureNodes
ParticipantsPerNode
OccupancyCompliant
NodesPerParameter
Overparameterized
SupportStatus
AIC_scaled
BIC_scaled
Entropy_scaled
Reproducibility_scaled
Posterior_scaled
ahp_index
Eligible
Recommended
GridDesignPolicy
GridDesignK
TargetNodesPerProfile
SOMNodeCount
ExpectedNodesPerProfile
1
4
-152.908
63
25
431.816
898.395
508.605
571.605
307.816
497.816
313.237
-508.605
1
1
1
NA
NA
5
8
0.2
0.32
80
0.25
1
1
0
1
0.996
0.992
0.997
0.994
1
0.996
0.997
0.994
1
0.996
0.992
0.997
0.994
0.996
0.996
0
0
63
25
12.8
TRUE
0.397
TRUE
over-parameterized
NA
NA
NA
NA
0
NA
FALSE
FALSE
explicit_dimensions
4
20
25
6.25
# }