
Build a heatmap of pairwise group contrasts against a required referent
group. Continuous outcomes are always transformed using the referent group
before modeling: Z-scores when Parametric = TRUE, and M-scores when
Parametric = FALSE.
Usage
MakePairwiseHeatmap(
  data,
  group_var,
  variables,
  Referent,
  covariates = NULL,
  Parametric = TRUE,
  alternative = c("two.sided", "greater", "less"),
  adjust_scope = c("per_group", "per_variable", "matrix", "none"),
  p_adjust_method = c("fdr", "bonferroni", "holm", "none"),
  star_p = c("raw", "adjusted", "none"),
  adjusted_outline = TRUE,
  adjusted_significance_threshold = 0.05,
  adjusted_outline_color = "black",
  adjusted_outline_linewidth = 1,
  low_color = "#52BCA3FF",
  mid_color = "white",
  high_color = "#E58606FF",
  fill_midpoint = 0,
  fill_limits = NULL,
  fill_oob = scales::squish,
  cluster_rows = FALSE,
  cluster_columns = FALSE,
  show_caption = FALSE,
  x_axis_text_angle = 0,
  return_models = FALSE,
  star_color = "black",
  star_size = 4,
  IncludeTrendSymbol = FALSE
)
Arguments
- data
A data frame.
- group_var
Character scalar naming the grouping variable.
- variables
Character vector of continuous outcome variables.
- Referent
Character scalar naming the referent level of
group_var.- covariates
Optional character vector of covariates.
- Parametric
Logical. If
TRUE, outcomes are Z-scored before modeling.- alternative
Hypothesis alternative for an exact two-group contrast.
"greater"tests the second factor level against the first. With a one-sided test,Referentmust be the first factor level. IfFALSE, outcomes are M-scored and HC3 robust covariance is used for estimated marginal mean contrasts.- adjust_scope
Multiple-comparison correction scope.
"per_group"adjusts across variables within each group-vs-referent contrast;"per_variable"adjusts across group contrasts within each variable;"matrix"adjusts across all displayed cells;"none"applies no correction.- p_adjust_method
Method passed to
stats::p.adjust(). Use"none"for no correction.- star_p
Which p-values should drive cell stars: raw, adjusted, or none.
- adjusted_outline
Logical; outline cells significant after adjustment.
- adjusted_significance_threshold
Threshold for adjusted-significant outlines.
- adjusted_outline_color, adjusted_outline_linewidth
Appearance of the adjusted-significant outline.
- low_color, mid_color, high_color
Diverging heatmap colors.
- fill_midpoint
Numeric midpoint for the fill scale.
- fill_limits
Optional numeric vector of length 2. If
NULL, symmetric limits are computed from the observed estimated mean differences.- fill_oob
Out-of-bounds handler for the fill scale.
- cluster_rows, cluster_columns
Logical; optionally cluster rows or columns based on estimated mean differences.
- show_caption
Logical; add an explanatory caption to the plot.
- x_axis_text_angle
Numeric angle for x-axis labels. Defaults to
0.- return_models
Logical; include fitted model objects in the return.
- star_color, star_size
Appearance of p-value stars.
- IncludeTrendSymbol
Logical; add a plus sign for
0.05 < p <= 0.10.
Value
An object of class "SciDataReportRPairwiseHeatmap" with Plot,
Results, Models, Settings, ScalingParameters, and Warnings.
Results includes readable audit columns such as Test, Contrast,
Adjustment, and ModelFormula.
Details
Each cell is an estimated marginal mean contrast from the model
referent_scaled_outcome ~ group_var + covariates, computed as
Group - Referent. Scaling parameters are estimated in the referent group
and projected onto the full dataset before modeling. With the defaults,
adjusted p-values use FDR correction within each group-vs-referent contrast
across variables.
When to use it
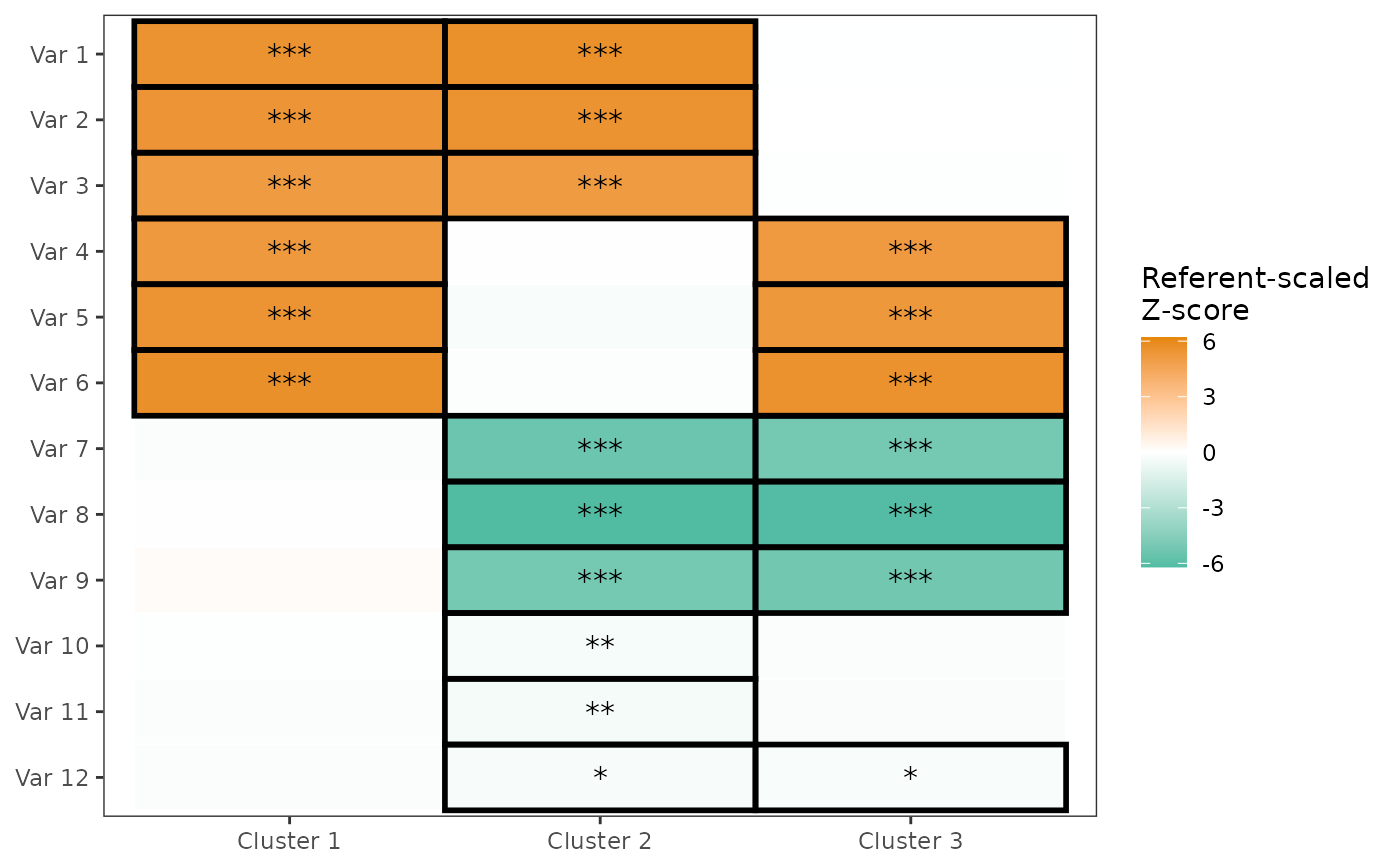
This plot earns its keep when the grouping has several levels. With only two groups it is a single column of cells and a comparison table says the same thing more compactly. A cluster assignment is the typical case: the clusters already exist, and the question is what actually distinguishes each one from the reference cluster.
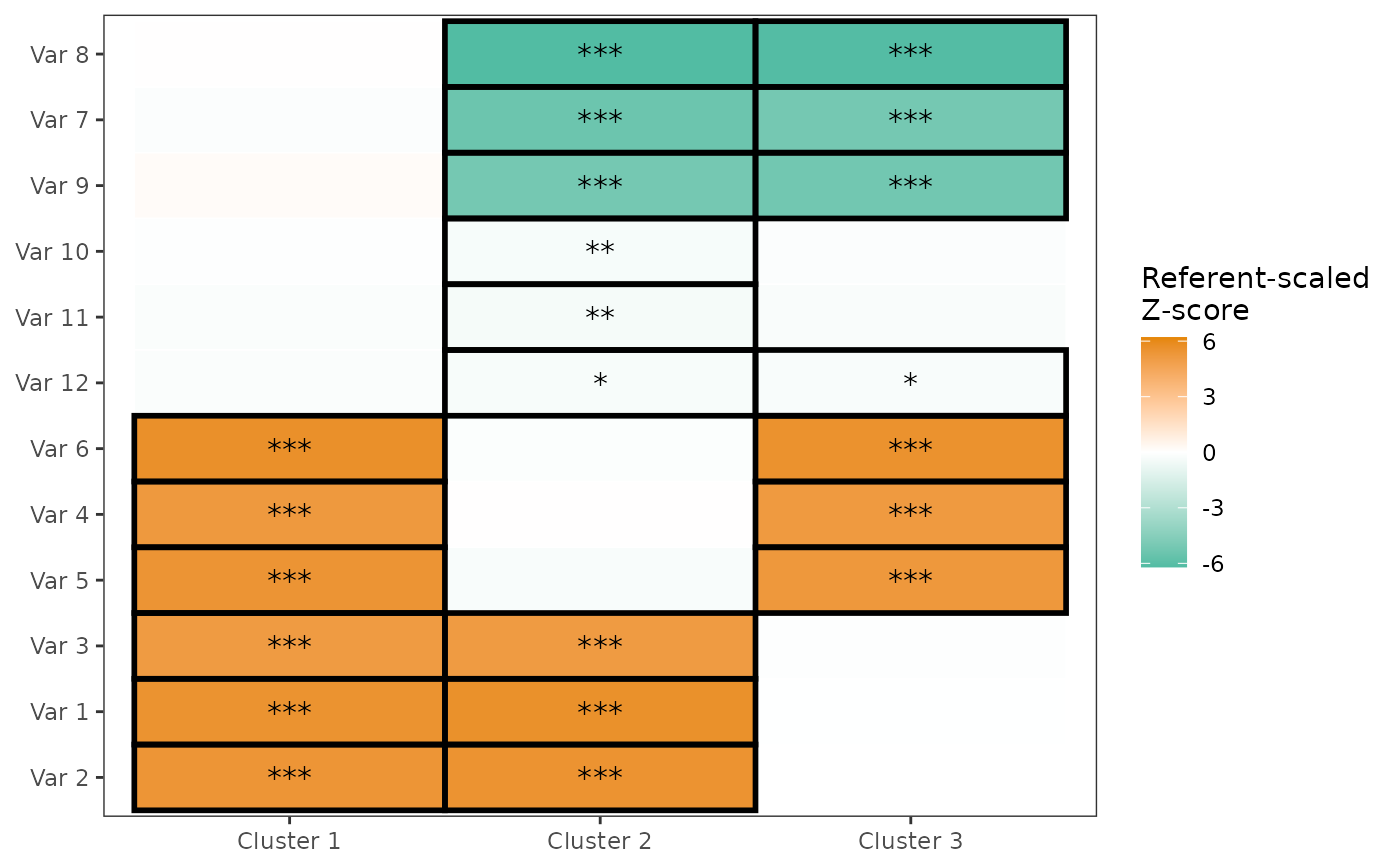
The result is one column per non-referent group and one row per measure, so a block structure in the cells is the phenotype definition - each group standing apart on its own set of variables, and variables that separate nothing left blank across the whole row.
Every cell is backed by an auditable row in Results: the contrast, the
model that produced it, the group sizes, the raw and adjusted p-values, and
the correction that was applied.
Options that change the estimates
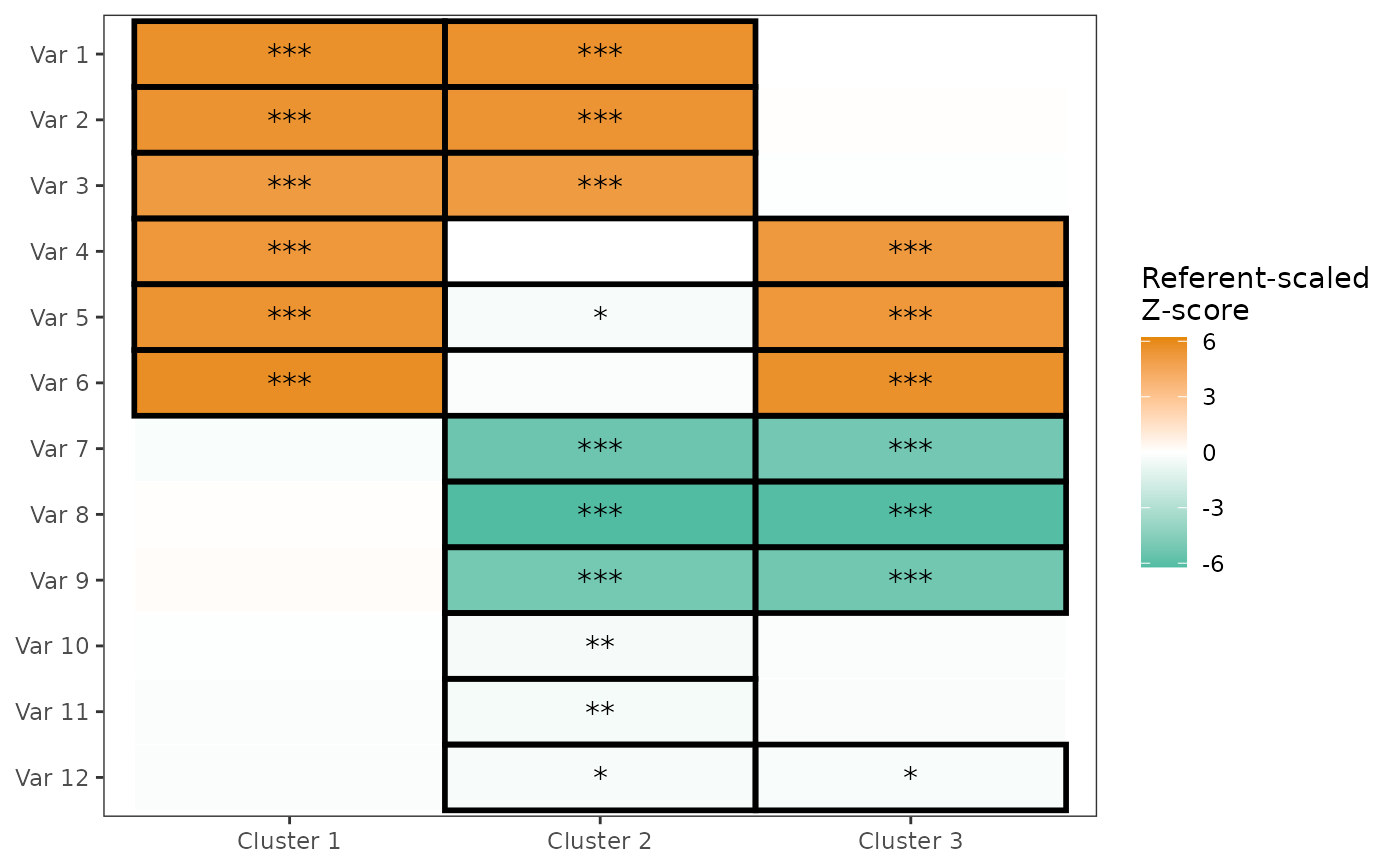
covariates turns each contrast into the group difference that survives
holding the named variables constant.
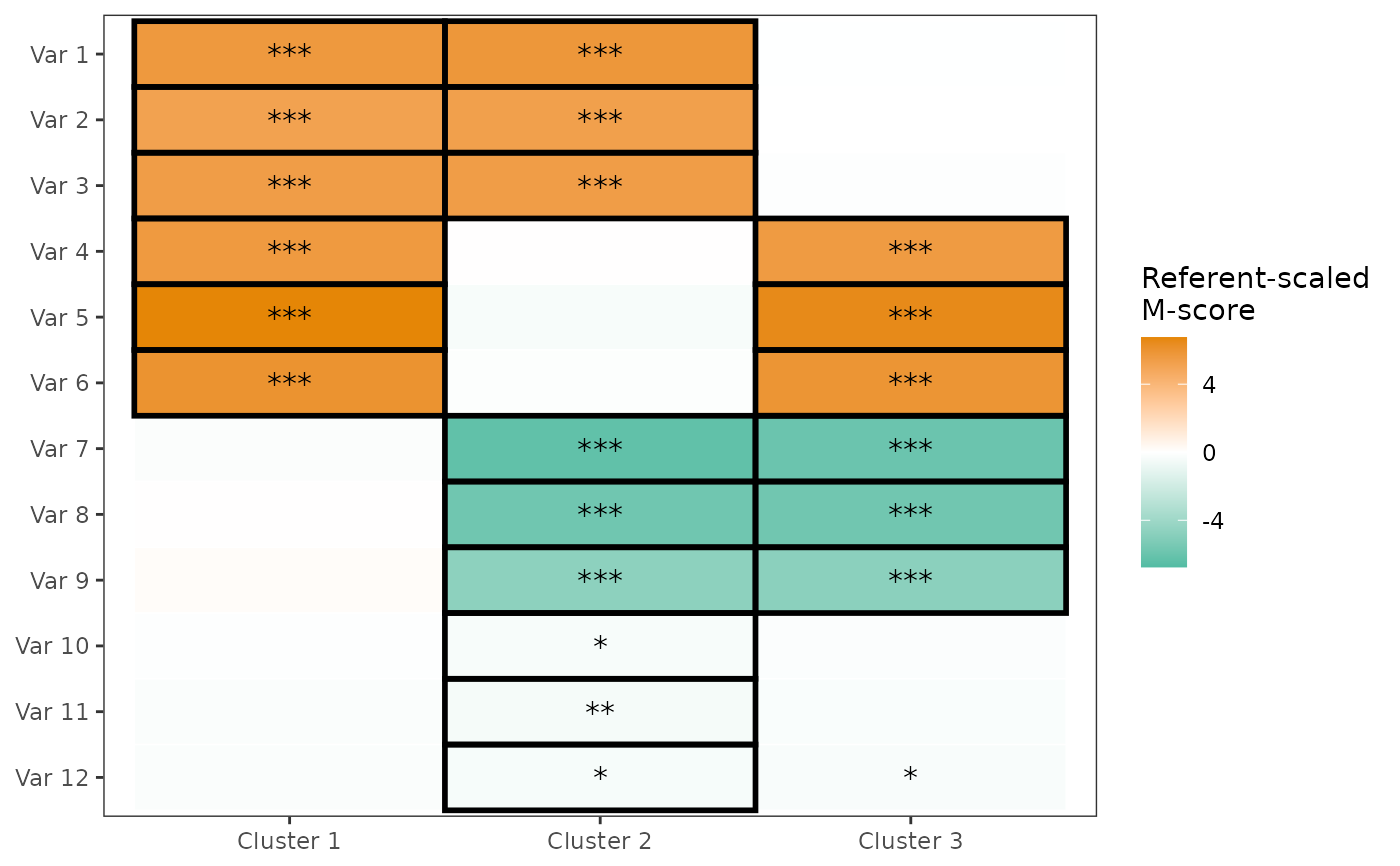
Parametric = FALSE switches from Z-scores to M-scores with robust
(HC3) standard errors, for outcomes with outliers or heavy tails.
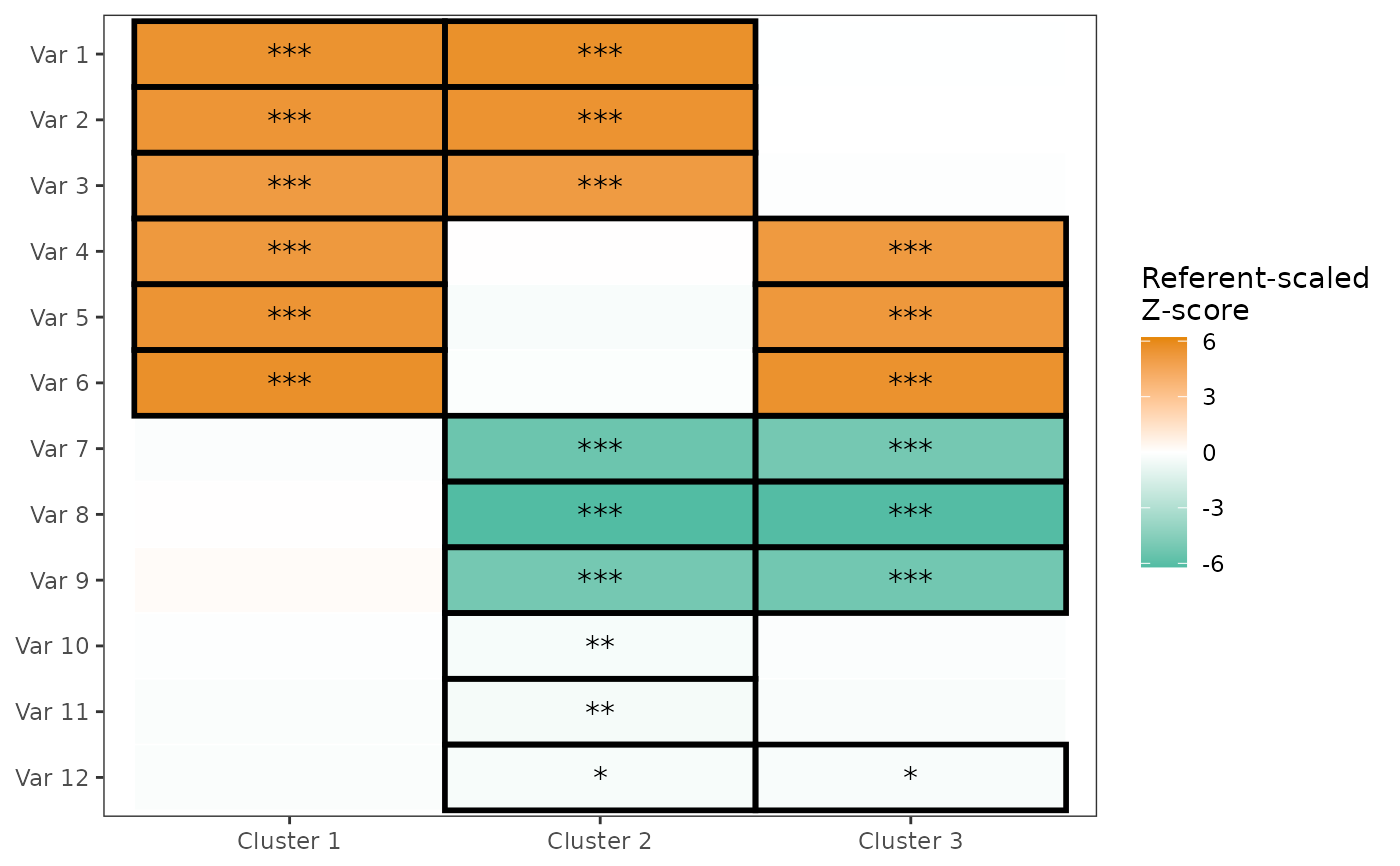
adjust_scope decides what counts as one family of tests. The default
corrects across variables within each group-vs-referent contrast;
"matrix" corrects across every cell shown, which is stricter and
appropriate when the whole heatmap is being scanned for anything
significant.
cluster_rows groups variables that behave alike across contrasts, so
the blocks can be read straight off the axis.
Examples
# \donttest{
data(SimulatedPhenotypeData)
vars_Numeric <- paste0("Var", 1:12)
res <- MakePairwiseHeatmap(
data = SimulatedPhenotypeData,
group_var = "TruthCluster",
variables = vars_Numeric,
Referent = "Cluster 4"
)
# One column per non-referent cluster, one row per measure
res$Plot
 # The auditable row behind every cell
htmltools::browsable(htmltools::HTML(as.character(
FreezeTableHeader(
dplyr::mutate(
dplyr::select(
res$Results,
Variable, Group, Referent, NGroup, NReferent,
EstimatedMeanDifference, PValue, AdjustedPValue,
SignificanceLabel, Test, Adjustment
),
dplyr::across(dplyr::where(is.numeric), \(x) round(x, 4))
),
height = "320px", full_width = TRUE
)
)))
# The auditable row behind every cell
htmltools::browsable(htmltools::HTML(as.character(
FreezeTableHeader(
dplyr::mutate(
dplyr::select(
res$Results,
Variable, Group, Referent, NGroup, NReferent,
EstimatedMeanDifference, PValue, AdjustedPValue,
SignificanceLabel, Test, Adjustment
),
dplyr::across(dplyr::where(is.numeric), \(x) round(x, 4))
),
height = "320px", full_width = TRUE
)
)))
Variable
Group
Referent
NGroup
NReferent
EstimatedMeanDifference
PValue
AdjustedPValue
SignificanceLabel
Test
Adjustment
Var1
Cluster 1
Cluster 4
120
120
5.5380
0.0000
0.0000
***
Linear model + emmeans referent contrast
FDR correction within each group-vs-referent contrast across variables
Var1
Cluster 2
Cluster 4
120
120
5.6403
0.0000
0.0000
***
Linear model + emmeans referent contrast
FDR correction within each group-vs-referent contrast across variables
Var1
Cluster 3
Cluster 4
120
120
-0.0296
0.8300
0.8933
Linear model + emmeans referent contrast
FDR correction within each group-vs-referent contrast across variables
Var2
Cluster 1
Cluster 4
120
120
5.3980
0.0000
0.0000
***
Linear model + emmeans referent contrast
FDR correction within each group-vs-referent contrast across variables
Var2
Cluster 2
Cluster 4
120
120
5.5175
0.0000
0.0000
***
Linear model + emmeans referent contrast
FDR correction within each group-vs-referent contrast across variables
Var2
Cluster 3
Cluster 4
120
120
-0.0181
0.8933
0.8933
Linear model + emmeans referent contrast
FDR correction within each group-vs-referent contrast across variables
Var3
Cluster 1
Cluster 4
120
120
5.0905
0.0000
0.0000
***
Linear model + emmeans referent contrast
FDR correction within each group-vs-referent contrast across variables
Var3
Cluster 2
Cluster 4
120
120
5.1108
0.0000
0.0000
***
Linear model + emmeans referent contrast
FDR correction within each group-vs-referent contrast across variables
Var3
Cluster 3
Cluster 4
120
120
-0.0930
0.4690
0.5628
Linear model + emmeans referent contrast
FDR correction within each group-vs-referent contrast across variables
Var4
Cluster 1
Cluster 4
120
120
5.2024
0.0000
0.0000
***
Linear model + emmeans referent contrast
FDR correction within each group-vs-referent contrast across variables
Var4
Cluster 2
Cluster 4
120
120
0.0388
0.7388
0.7388
Linear model + emmeans referent contrast
FDR correction within each group-vs-referent contrast across variables
Var4
Cluster 3
Cluster 4
120
120
5.1590
0.0000
0.0000
***
Linear model + emmeans referent contrast
FDR correction within each group-vs-referent contrast across variables
Var5
Cluster 1
Cluster 4
120
120
5.4429
0.0000
0.0000
***
Linear model + emmeans referent contrast
FDR correction within each group-vs-referent contrast across variables
Var5
Cluster 2
Cluster 4
120
120
-0.2632
0.0545
0.0654
Linear model + emmeans referent contrast
FDR correction within each group-vs-referent contrast across variables
Var5
Cluster 3
Cluster 4
120
120
5.2524
0.0000
0.0000
***
Linear model + emmeans referent contrast
FDR correction within each group-vs-referent contrast across variables
Var6
Cluster 1
Cluster 4
120
120
5.6743
0.0000
0.0000
***
Linear model + emmeans referent contrast
FDR correction within each group-vs-referent contrast across variables
Var6
Cluster 2
Cluster 4
120
120
-0.1369
0.3178
0.3467
Linear model + emmeans referent contrast
FDR correction within each group-vs-referent contrast across variables
Var6
Cluster 3
Cluster 4
120
120
5.5785
0.0000
0.0000
***
Linear model + emmeans referent contrast
FDR correction within each group-vs-referent contrast across variables
Var7
Cluster 1
Cluster 4
120
120
-0.1587
0.1859
0.2231
Linear model + emmeans referent contrast
FDR correction within each group-vs-referent contrast across variables
Var7
Cluster 2
Cluster 4
120
120
-5.4248
0.0000
0.0000
***
Linear model + emmeans referent contrast
FDR correction within each group-vs-referent contrast across variables
Var7
Cluster 3
Cluster 4
120
120
-5.1362
0.0000
0.0000
***
Linear model + emmeans referent contrast
FDR correction within each group-vs-referent contrast across variables
Var8
Cluster 1
Cluster 4
120
120
0.0332
0.8205
0.8205
Linear model + emmeans referent contrast
FDR correction within each group-vs-referent contrast across variables
Var8
Cluster 2
Cluster 4
120
120
-6.2000
0.0000
0.0000
***
Linear model + emmeans referent contrast
FDR correction within each group-vs-referent contrast across variables
Var8
Cluster 3
Cluster 4
120
120
-6.1580
0.0000
0.0000
***
Linear model + emmeans referent contrast
FDR correction within each group-vs-referent contrast across variables
Var9
Cluster 1
Cluster 4
120
120
0.1735
0.1606
0.2141
Linear model + emmeans referent contrast
FDR correction within each group-vs-referent contrast across variables
Var9
Cluster 2
Cluster 4
120
120
-5.1434
0.0000
0.0000
***
Linear model + emmeans referent contrast
FDR correction within each group-vs-referent contrast across variables
Var9
Cluster 3
Cluster 4
120
120
-5.2210
0.0000
0.0000
***
Linear model + emmeans referent contrast
FDR correction within each group-vs-referent contrast across variables
Var10
Cluster 1
Cluster 4
120
120
-0.0913
0.4643
0.5065
Linear model + emmeans referent contrast
FDR correction within each group-vs-referent contrast across variables
Var10
Cluster 2
Cluster 4
120
120
-0.3300
0.0084
0.0125
**
Linear model + emmeans referent contrast
FDR correction within each group-vs-referent contrast across variables
Var10
Cluster 3
Cluster 4
120
120
-0.1618
0.1949
0.2599
Linear model + emmeans referent contrast
FDR correction within each group-vs-referent contrast across variables
Var11
Cluster 1
Cluster 4
120
120
-0.1887
0.1376
0.2074
Linear model + emmeans referent contrast
FDR correction within each group-vs-referent contrast across variables
Var11
Cluster 2
Cluster 4
120
120
-0.3958
0.0019
0.0033
**
Linear model + emmeans referent contrast
FDR correction within each group-vs-referent contrast across variables
Var11
Cluster 3
Cluster 4
120
120
-0.2384
0.0609
0.0914
Linear model + emmeans referent contrast
FDR correction within each group-vs-referent contrast across variables
Var12
Cluster 1
Cluster 4
115
120
-0.1843
0.1383
0.2074
Linear model + emmeans referent contrast
FDR correction within each group-vs-referent contrast across variables
Var12
Cluster 2
Cluster 4
120
120
-0.3162
0.0103
0.0138
*
Linear model + emmeans referent contrast
FDR correction within each group-vs-referent contrast across variables
Var12
Cluster 3
Cluster 4
120
120
-0.2718
0.0274
0.0469
*
Linear model + emmeans referent contrast
FDR correction within each group-vs-referent contrast across variables
# Adjusted for a covariate
MakePairwiseHeatmap(
data = SimulatedPhenotypeData,
group_var = "TruthCluster",
variables = vars_Numeric,
Referent = "Cluster 4",
covariates = "DensityX"
)$Plot
 # M-scores with robust (HC3) standard errors
MakePairwiseHeatmap(
data = SimulatedPhenotypeData,
group_var = "TruthCluster",
variables = vars_Numeric,
Referent = "Cluster 4",
Parametric = FALSE
)$Plot
# M-scores with robust (HC3) standard errors
MakePairwiseHeatmap(
data = SimulatedPhenotypeData,
group_var = "TruthCluster",
variables = vars_Numeric,
Referent = "Cluster 4",
Parametric = FALSE
)$Plot
 # Correct across every cell shown, rather than within each contrast
MakePairwiseHeatmap(
data = SimulatedPhenotypeData,
group_var = "TruthCluster",
variables = vars_Numeric,
Referent = "Cluster 4",
adjust_scope = "matrix"
)$Plot
# Correct across every cell shown, rather than within each contrast
MakePairwiseHeatmap(
data = SimulatedPhenotypeData,
group_var = "TruthCluster",
variables = vars_Numeric,
Referent = "Cluster 4",
adjust_scope = "matrix"
)$Plot
 # Group variables that behave alike across contrasts
MakePairwiseHeatmap(
data = SimulatedPhenotypeData,
group_var = "TruthCluster",
variables = vars_Numeric,
Referent = "Cluster 4",
cluster_rows = TRUE
)$Plot
# Group variables that behave alike across contrasts
MakePairwiseHeatmap(
data = SimulatedPhenotypeData,
group_var = "TruthCluster",
variables = vars_Numeric,
Referent = "Cluster 4",
cluster_rows = TRUE
)$Plot
 # }
# }