
Multivariable regression table
Source:R/MultivariableRegressionTable.R
MultivariableRegressionTable.RdFit one multivariable regression model per outcome and return a stable, label-aware regression object for downstream tables, diagnostics, and plots.
Usage
MultivariableRegressionTable(
  data,
  outcome_vars,
  predictor_vars,
  covariates = NULL,
  Standardize = TRUE,
  Relabel = TRUE,
  TreatOrdinalAs = "Categorical",
  FDR = TRUE,
  FDRAlpha = 0.05,
  IncludeTrendSymbol = FALSE,
  Method = c("lm", "ridge", "lasso", "elasticnet"),
  CVFolds = 10,
  Lambda = c("lambda.min", "lambda.1se"),
  Seed = 123,
  MissingDataStrategy = c("drop_sparse_impute", "impute", "complete_cases",
    "drop_sparse_complete_cases"),
  MaxMissingPredictor = 0.3,
  ImputeMethod = c("median_mode"),
  MinCompleteCases = NULL,
  outcome_modes = "auto",
  reference_levels = NULL,
  binary_subsets = NULL,
  Data = lifecycle::deprecated(),
  OutcomeVars = lifecycle::deprecated(),
  PredictorVars = lifecycle::deprecated(),
  Covars = lifecycle::deprecated()
)
Arguments
- data
Data frame containing outcomes, predictors, and covariates.
- outcome_vars
Character vector of outcome variable names.
- predictor_vars
Character vector of predictor variable names.
- covariates
Optional character vector of covariate variable names. Covariates are treated as mandatory adjustments: for penalized methods (
"ridge","lasso","elasticnet") they are exempted from the penalty (penalty.factor = 0), so they are never shrunk or selected out of the model.- Standardize
Logical. If
TRUE, ordinary models are fit on standardized continuous variables for the primary estimate. Standardized coefficients are always calculated separately regardless of this setting.- Relabel
Logical. If
TRUE, use variable labels fromsjlabelledwhen available.- TreatOrdinalAs
How ordinal outcomes and predictors are handled.
- FDR
Logical. If
TRUE, calculate FDR-adjusted p-values for ordinary regression terms.- FDRAlpha
Numeric FDR threshold retained in metadata.
- IncludeTrendSymbol
Logical; add a plus sign for
0.05 < p <= 0.10.- Method
Regression method. One of
"lm","ridge","lasso", or"elasticnet".- CVFolds
Number of cross-validation folds for penalized models.
- Lambda
Lambda selection rule for penalized models. One of
"lambda.min"or"lambda.1se".- Seed
Random seed used for deterministic cross-validation folds.
- MissingDataStrategy
Missing-data handling strategy. The default,
"drop_sparse_impute", drops sparse predictors and covariates, then imputes remaining predictor missingness.- MaxMissingPredictor
Maximum allowed missingness proportion for predictors and covariates before they are dropped by sparse-drop strategies. Default is
0.30.- ImputeMethod
Imputation method for predictor/covariate missingness. Currently
"median_mode": median for numeric variables and mode for factor, character, and logical variables.- MinCompleteCases
Optional minimum number of modeling rows required after missing-data handling.
- outcome_modes
Multi-category outcome strategy. Supply a single
"auto"or a named character vector whose values are"auto","multinomial","ordinal","one_vs_rest","binary_subset", or"skip". In automatic mode, ordered factors use proportional-odds regression and unordered factors use multinomial regression.- reference_levels
Optional named character vector giving reference levels for categorical outcomes. Unspecified outcomes use their first retained factor level.
- binary_subsets
Optional named list. Each outcome assigned
"binary_subset"must have exactly two level names here, ordered as reference then event.- Data
Deprecated (since 19.15.0). Use
datainstead.- OutcomeVars
Deprecated (since 19.15.0). Use
outcome_varsinstead.- PredictorVars
Deprecated (since 19.15.0). Use
predictor_varsinstead.- Covars
Deprecated (since 19.15.0). Use
covariatesinstead.
Value
A named list with stable components: Models, FormattedTable,
LargeTable, RegressionMatrix, VariableImportanceMatrix,
Predictions, Diagnostics, ModelSummary, Multicollinearity,
Plots, and Metadata. FormattedTable is a report-facing gt table
grouped by outcome, matching the style of
MakeUnivariateRegressionTable(): predictor rows only, a combined
Estimate (95% CI) cell, and bold significant p-values. LargeTable is a
data frame holding the full per-term detail (including covariate rows) for
programmatic use, plus an Aliased flag marking perfectly collinear terms
the model dropped. ModelSummary reports per-outcome Converged,
SeparationDetected, and AliasedTermCount. For ordinary ("lm")
logistic fits, quasi-complete separation is detected (fitted probabilities
pinned at 0/1, exploded standardized coefficients, or non-convergence); the
affected model's estimates are blanked (NA) and Converged is set to
FALSE so unreliable coefficients do not propagate into tables or plots.
ModelSummary also carries an omnibus model test per outcome
(ModelStat, ModelStatType, ModelPValue): an F-test for linear models
and a likelihood-ratio test for logistic models (NA for penalized fits,
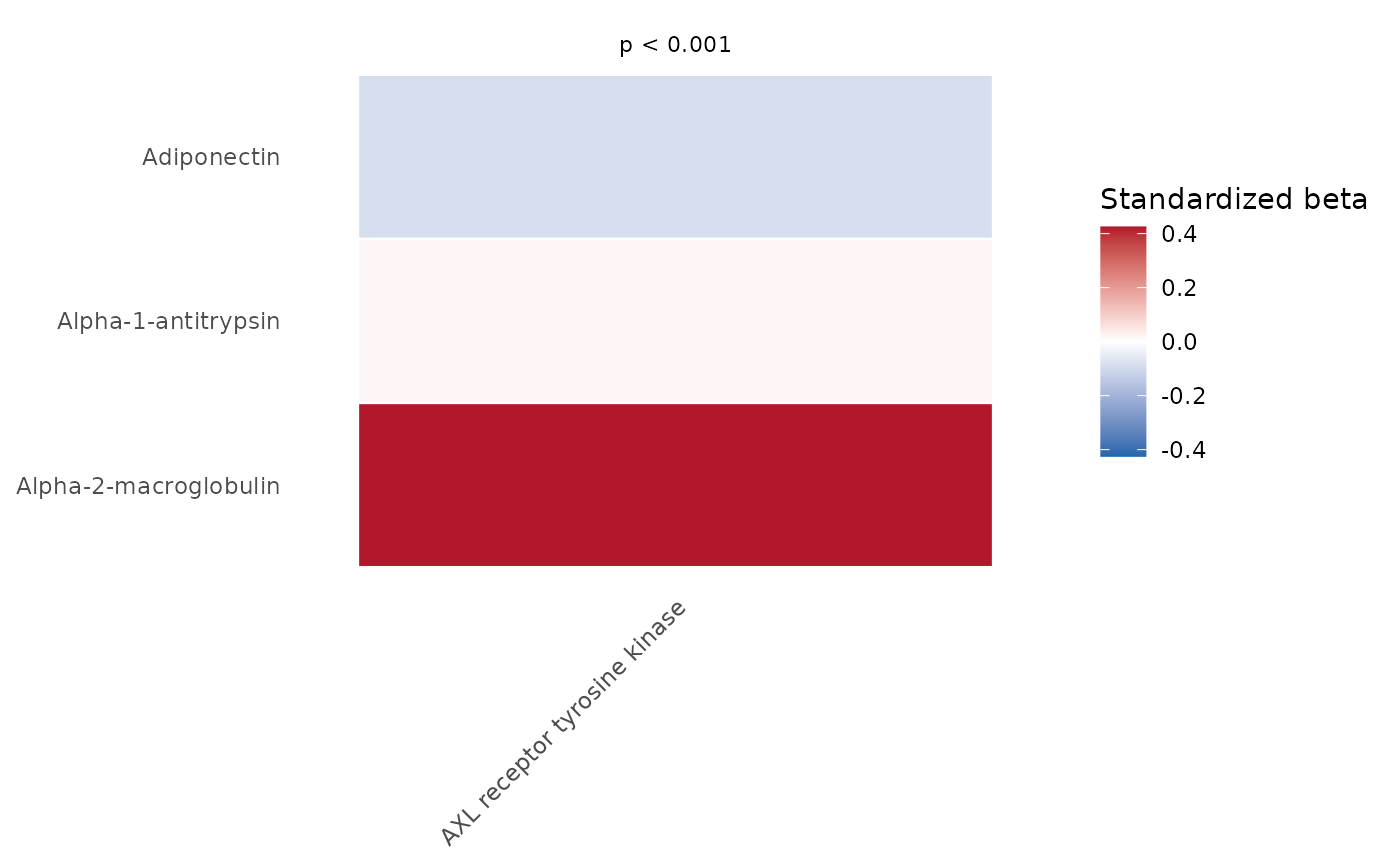
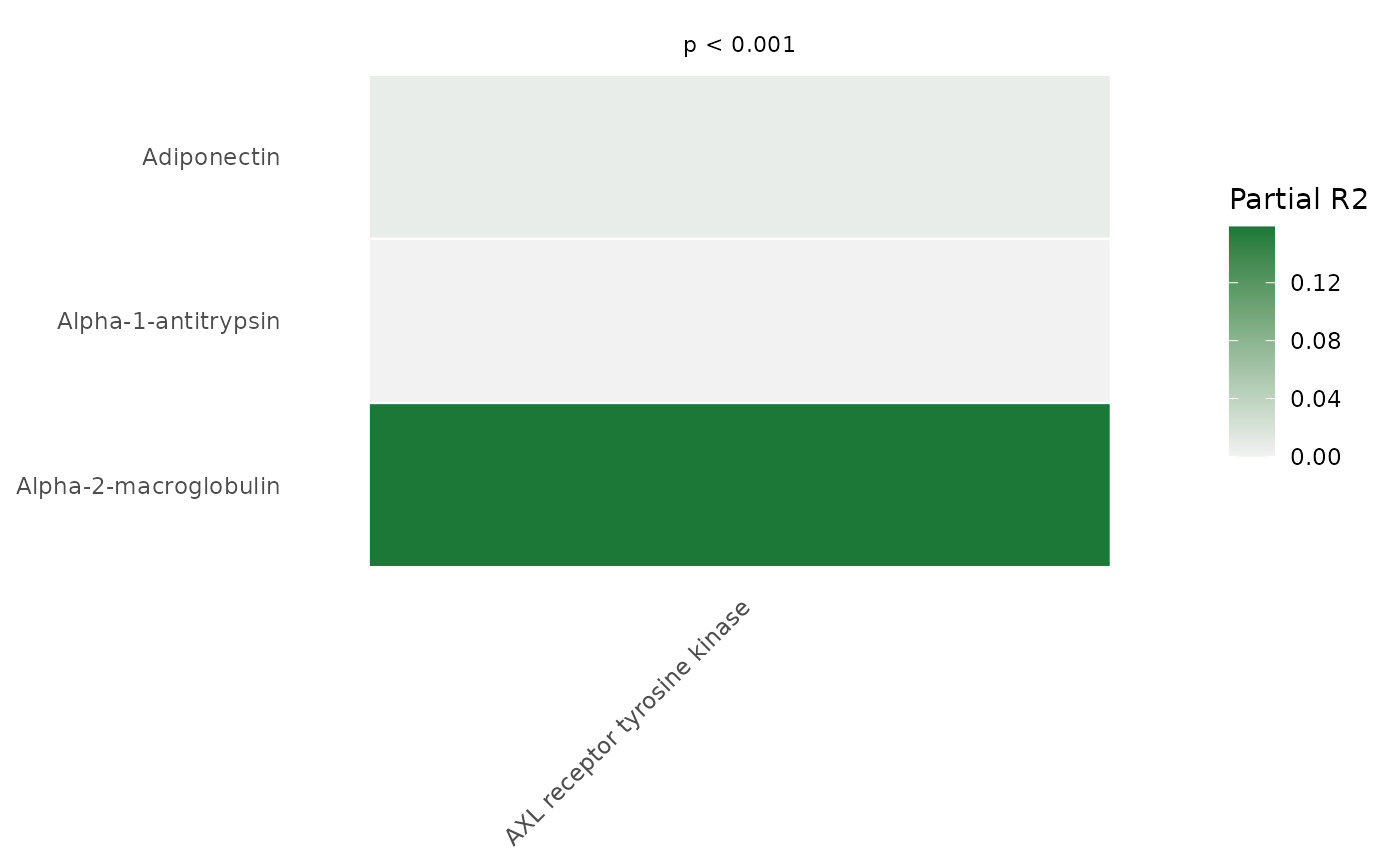
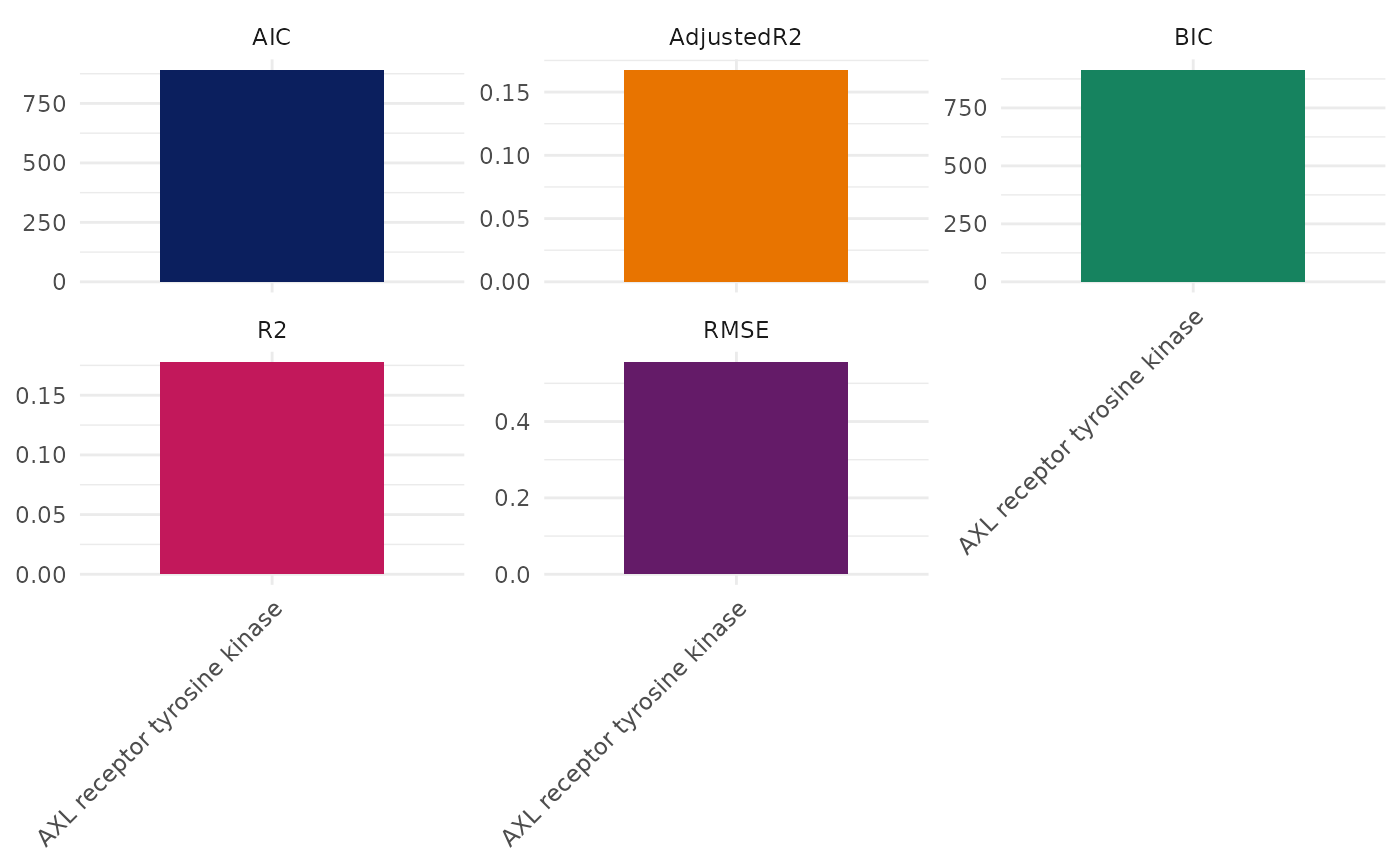
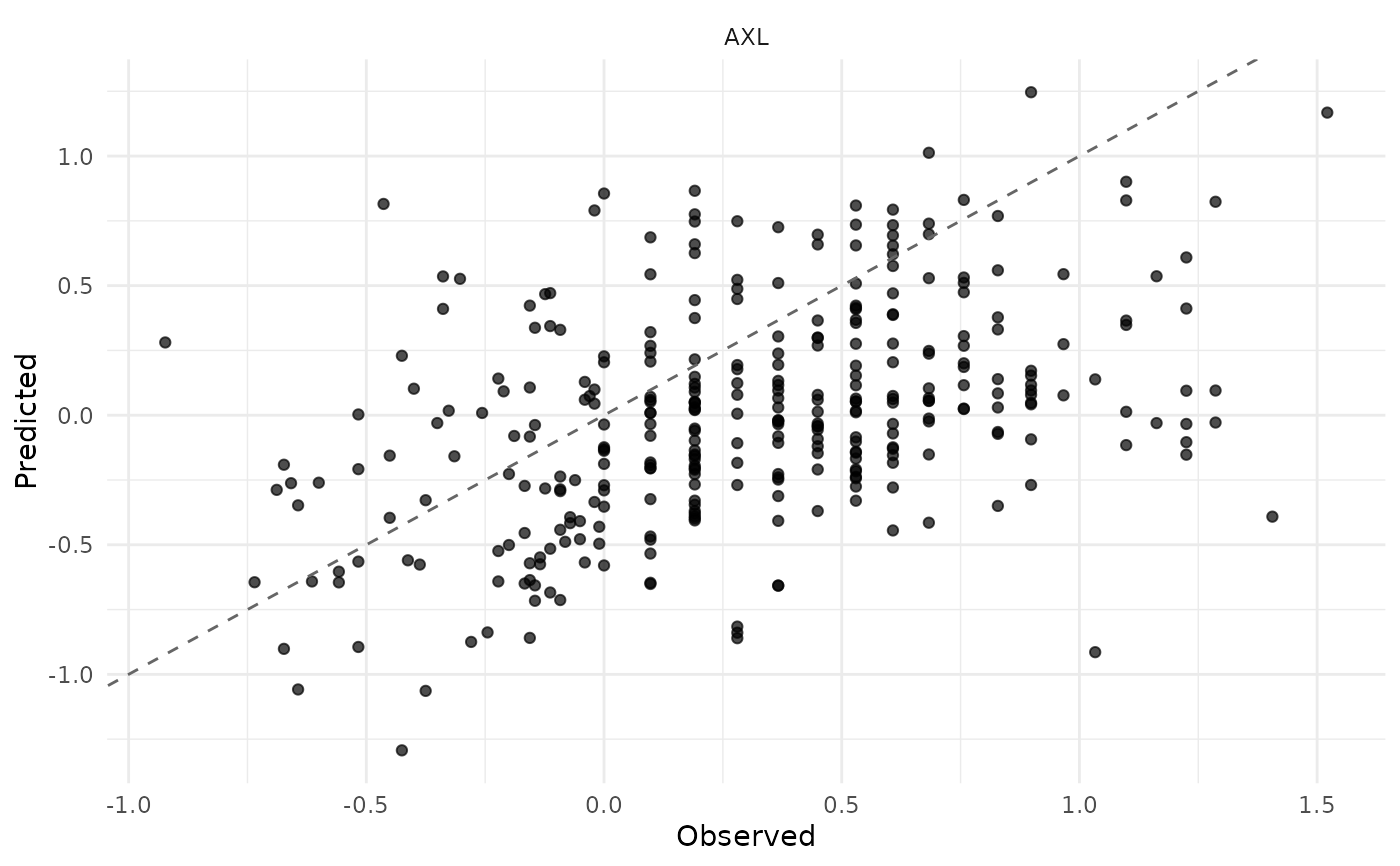
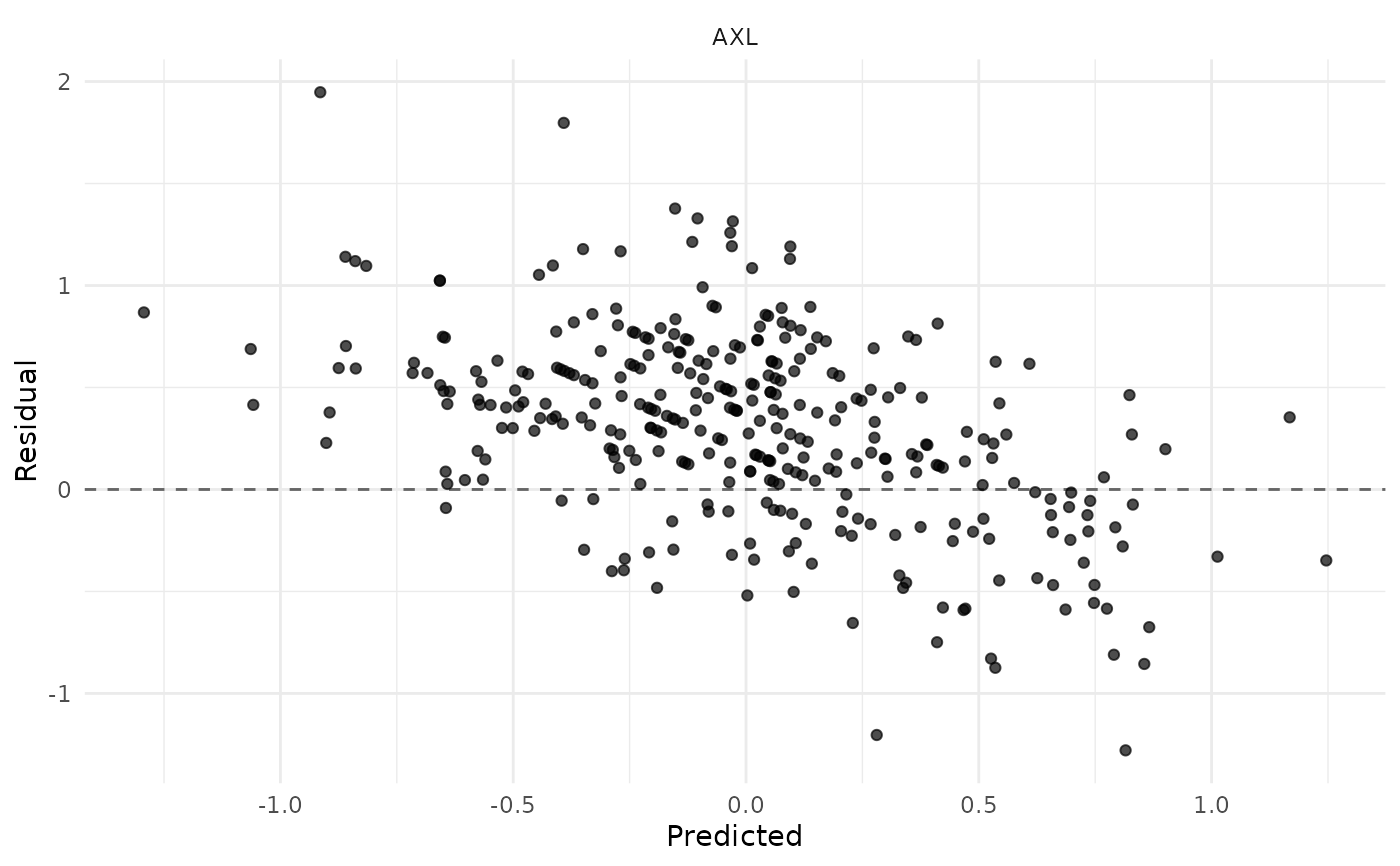
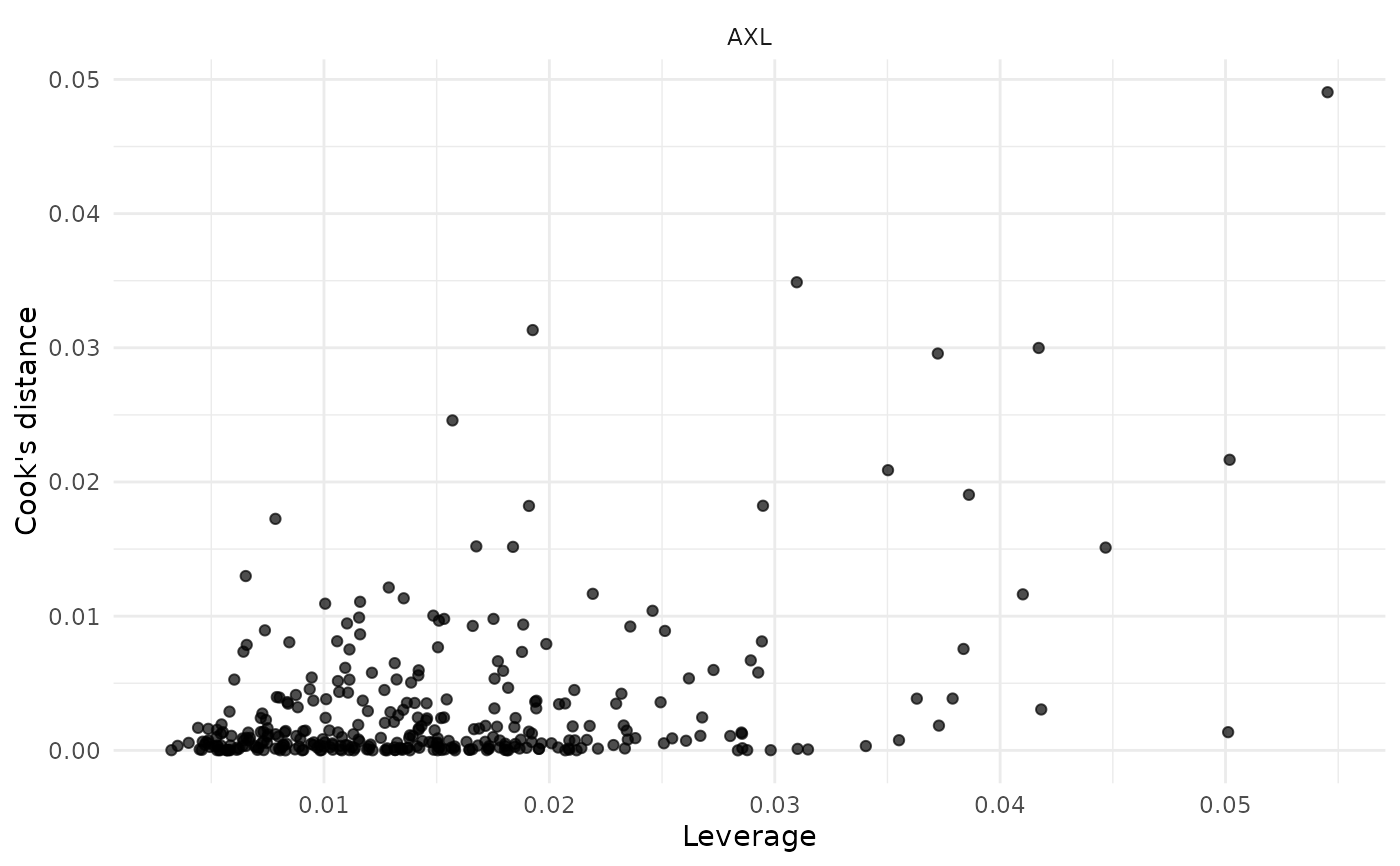
which have no valid classical omnibus test). Plots contains ggplot
objects built from the stored result tables and predictions without
refitting models; the coefficient heatmap uses robust, clamped fill limits
so a single extreme value cannot dominate the scale, and each outcome
column is annotated at the top with its omnibus p-value (ordinary models)
or cross-validated deviance explained (penalized models) to discourage
interpreting coefficients from a model that is not significant overall.
Multi-category outcomes add explicit OutcomeLevel, ReferenceLevel,
Contrast, ComparisonLabel, and OutcomeMode fields. Unordered factors
use nominal multinomial models by default. Ordered factors use
proportional-odds models; their odds ratios describe movement toward a
higher category, conditional on the predictors. One-vs-rest models are
available for level-specific scientific questions, but their overlapping
comparisons should be interpreted with multiplicity in mind. Binary
subsets change both the analysis population and estimand. The resolved
strategy, reference, engine, class counts, and concise scientific advice
are recorded under Metadata$Outcomes and Metadata$ModelingAdvice.
Examples
# \donttest{
data(SampleData)
data(SampleVariableTypes)
Labelled <- RevalueData(SampleData, SampleVariableTypes)$RevaluedData
result <- MultivariableRegressionTable(
Labelled,
outcome_vars = "AXL",
predictor_vars = c("Adiponectin", "Alpha_1_Antitrypsin", "Alpha_2_Macroglobulin"),
covariates = "age"
)
# Display every visualization available for this fitted model
for (plot_name in names(result$Plots)) {
print(result$Plots[[plot_name]])
}
 # Nominal outcome: each non-reference level versus the named reference.
ExampleData <- Labelled
ExampleData$Race <- factor(rep(c("Asian", "Black", "White"), length.out = nrow(ExampleData)))
nominal_result <- MultivariableRegressionTable(
ExampleData,
outcome_vars = "Race",
predictor_vars = c("Adiponectin", "Alpha_1_Antitrypsin"),
Method = "lasso",
reference_levels = c(Race = "White")
)
# Ordered outcome: one proportional-odds effect per predictor.
ExampleData$Severity <- ordered(
rep(c("Mild", "Moderate", "Severe"), length.out = nrow(ExampleData)),
levels = c("Mild", "Moderate", "Severe")
)
ordinal_result <- MultivariableRegressionTable(
ExampleData,
outcome_vars = "Severity",
predictor_vars = c("Adiponectin", "Alpha_1_Antitrypsin"),
Method = "lm"
)
# }
# Nominal outcome: each non-reference level versus the named reference.
ExampleData <- Labelled
ExampleData$Race <- factor(rep(c("Asian", "Black", "White"), length.out = nrow(ExampleData)))
nominal_result <- MultivariableRegressionTable(
ExampleData,
outcome_vars = "Race",
predictor_vars = c("Adiponectin", "Alpha_1_Antitrypsin"),
Method = "lasso",
reference_levels = c(Race = "White")
)
# Ordered outcome: one proportional-odds effect per predictor.
ExampleData$Severity <- ordered(
rep(c("Mild", "Moderate", "Severe"), length.out = nrow(ExampleData)),
levels = c("Mild", "Moderate", "Severe")
)
ordinal_result <- MultivariableRegressionTable(
ExampleData,
outcome_vars = "Severity",
predictor_vars = c("Adiponectin", "Alpha_1_Antitrypsin"),
Method = "lm"
)
# }