
Create a Forest Plot from Univariate Regression Tables
Source:R/PlotForestFromTable.R
PlotForestFromTable.RdThis function generates a forest plot from the results of
MakeUnivariateRegressionTable().
plotForestFromTable() was renamed to PlotForestFromTable()
in SciDataReportR 20.5.0 to match the package's Plot* naming
convention. It remains available as a backwards-compatible synonym.
Usage
PlotForestFromTable(UnivariateRegressionTables, pSize = 2, Flip = FALSE)

plotForestFromTable(UnivariateRegressionTables, pSize = 2, Flip = FALSE)
Arguments
- UnivariateRegressionTables
Either the full list returned by
MakeUnivariateRegressionTable()(itsResultsdataframe is used directly), or a dataframe with theResultscolumns. Passing a dataframe lets you filter, reorder, or relabelResultsbefore plotting; required columns areOutcomeLabel,TermLabel,Estimate,ConfLow,ConfHigh, andPValue(SignificantandReferenceValueare recomputed if absent). Lists created by older package versions (without aResultselement) are still supported.- pSize
Numeric. Size of the points in the plot. Default is 2.
- Flip
Logical. If
FALSE, outcomes are facets and predictors/terms are rows. IfTRUE, predictors/terms are facets and outcomes are rows.
Reading the plot
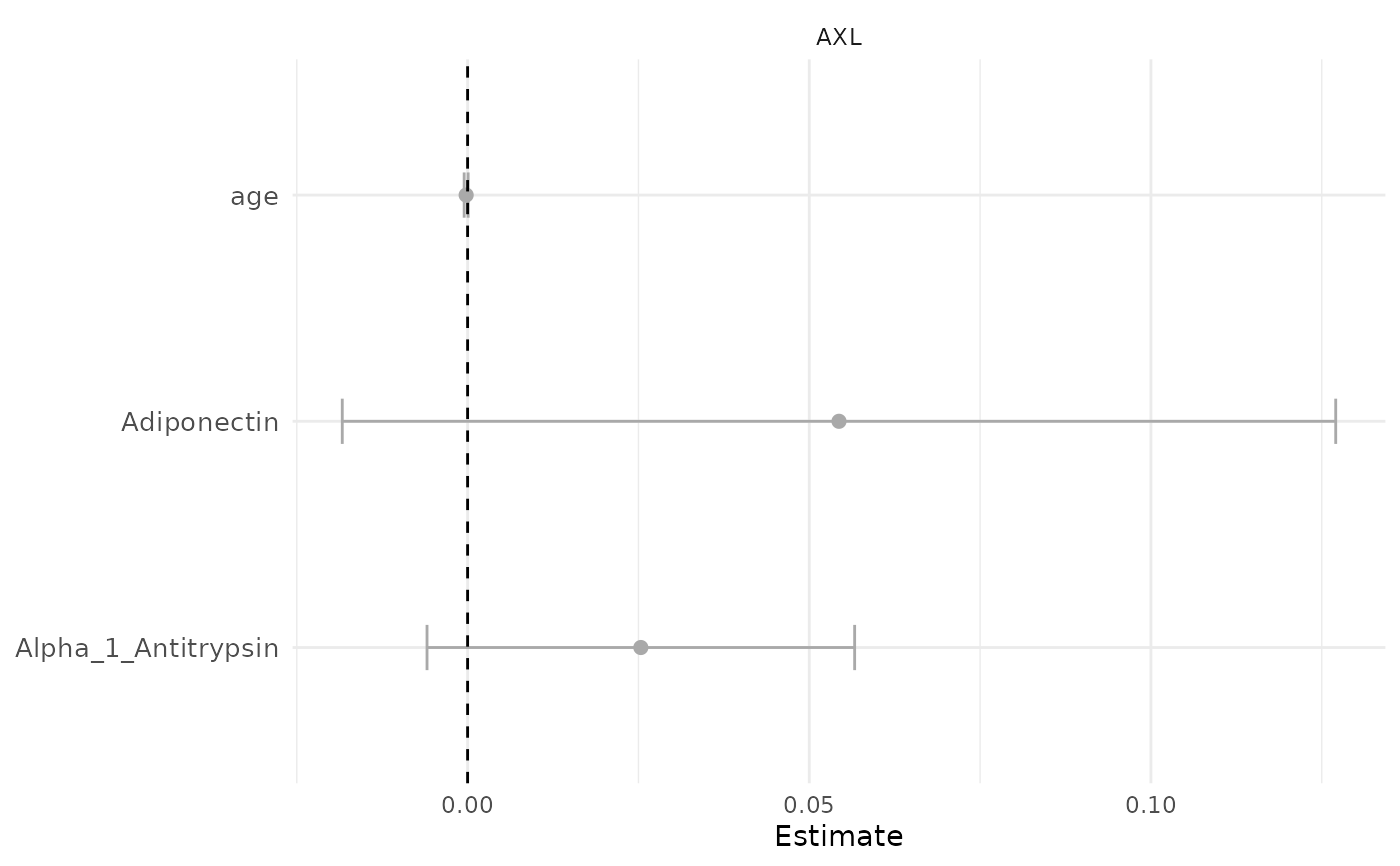
The forest plot earns its place when several predictors are screened against several outcomes at once: one panel per outcome, the same predictors down every panel, so a predictor that matters for one outcome and not the others is visible in a single glance.
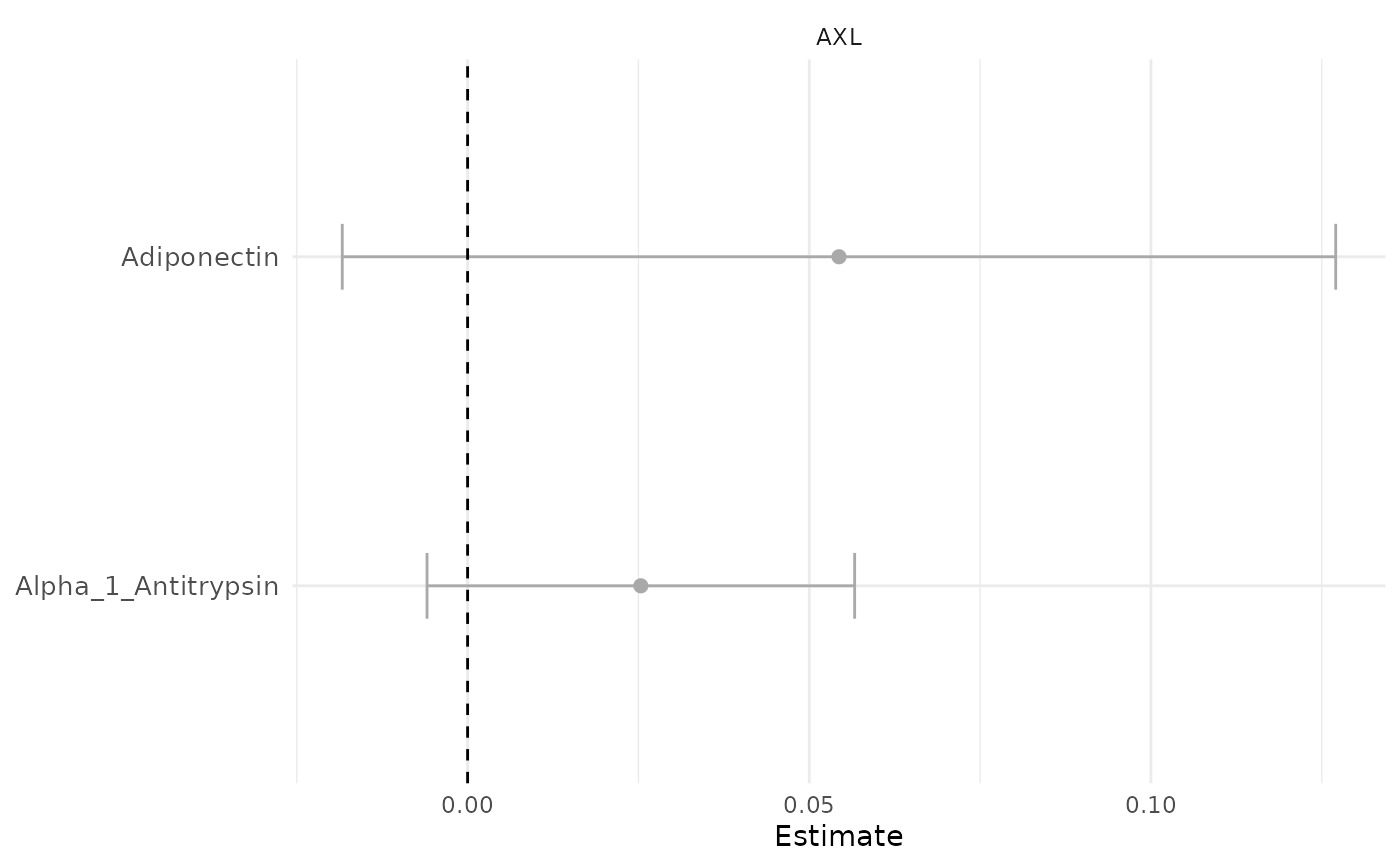
Flip = TRUE swaps the roles - one panel per predictor, outcomes down the
rows. Use it to ask "what does age predict?" rather than "what predicts
tau?": the same estimates, organized around the other question.
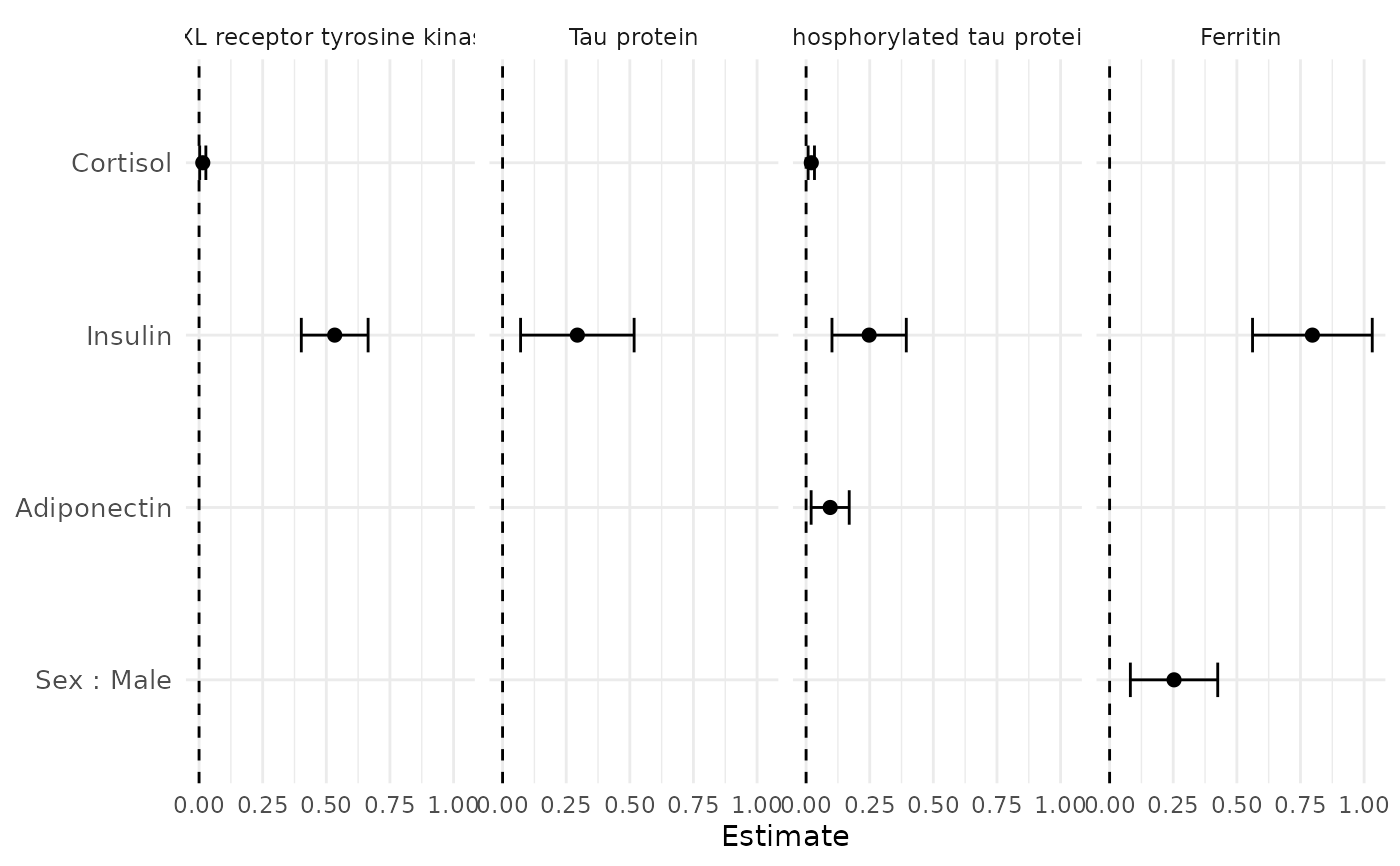
Passing the Results dataframe instead of the whole object means the plot
can be filtered first, for instance to the associations that survive FDR
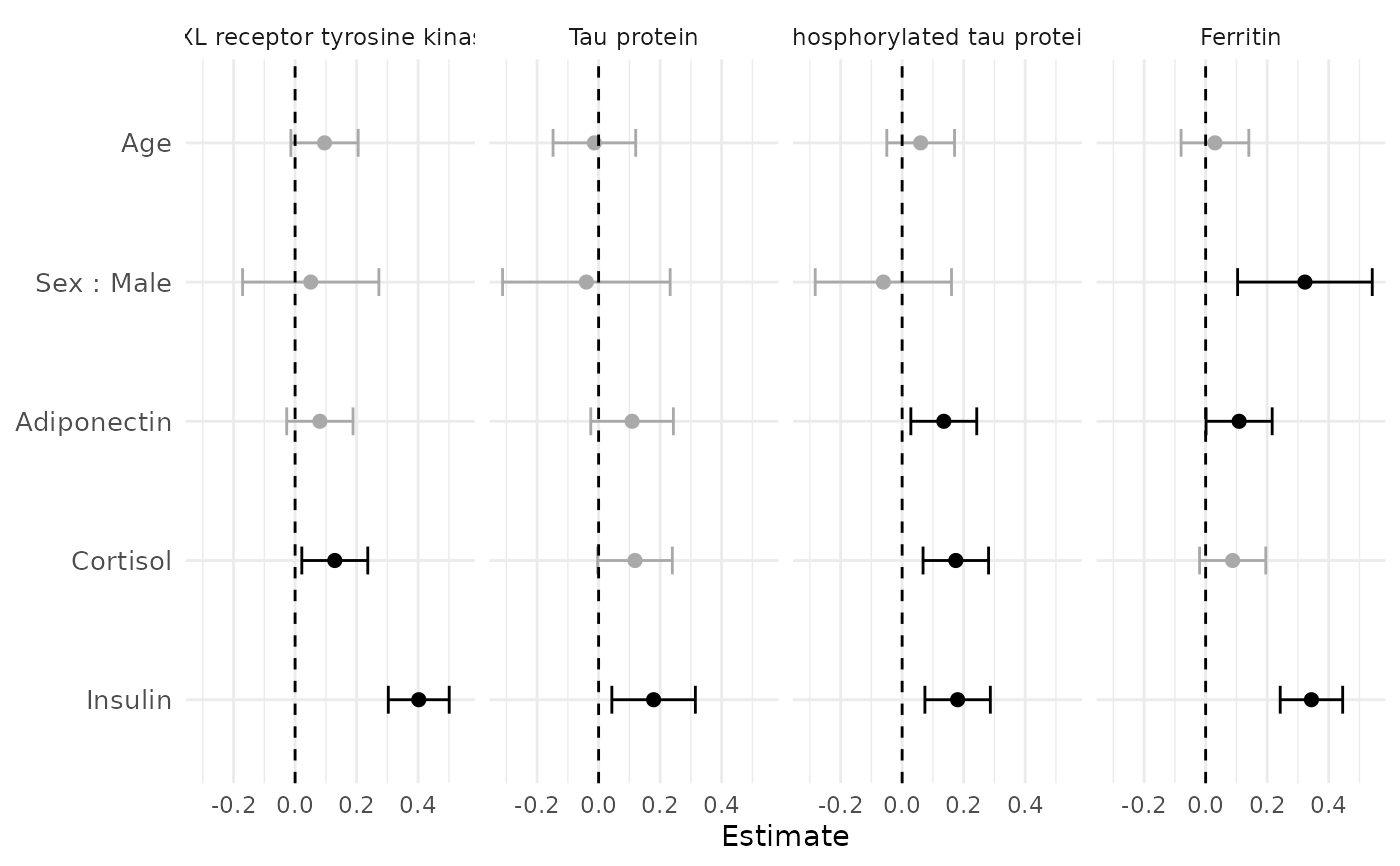
correction across the whole screen. Standardized estimates put every
predictor on the same axis, which is what makes the widths of the intervals
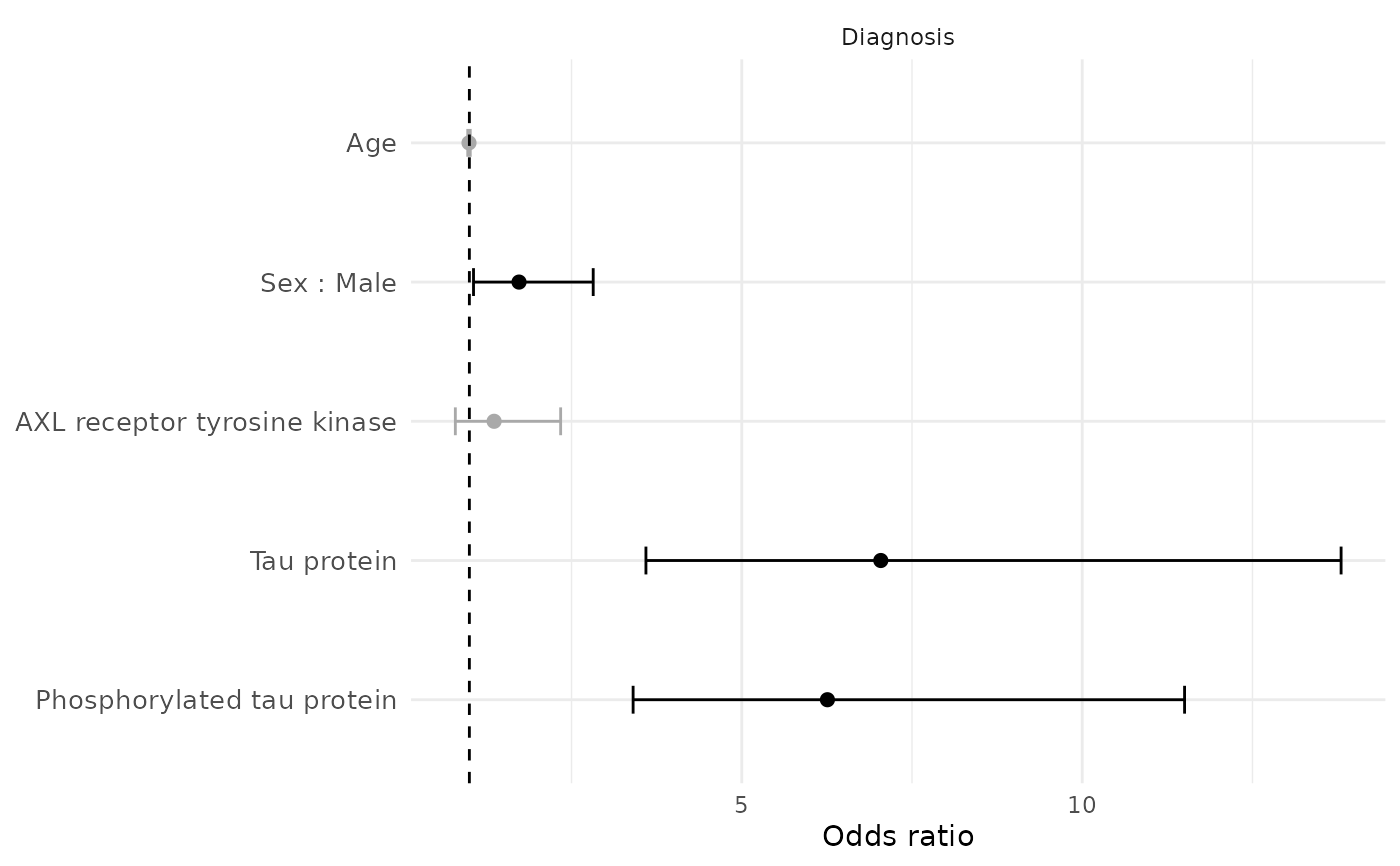
comparable across rows. A binary outcome gives odds ratios, and the
reference line moves from 0 to 1.
Examples
# \donttest{
data(SampleData)
data(SampleVariableTypes)
Labelled <- RevalueData(SampleData, SampleVariableTypes)$RevaluedData
# Several predictors screened against several outcomes
urt <- MakeUnivariateRegressionTable(
data = Labelled,
outcome_vars = c("AXL", "tau", "p_tau", "Ferritin"),
predictor_vars = c("age", "sex", "Adiponectin", "Cortisol", "Insulin")
)
PlotForestFromTable(urt)
 # One panel per predictor instead
PlotForestFromTable(urt, Flip = TRUE)
# One panel per predictor instead
PlotForestFromTable(urt, Flip = TRUE)
 # Filtered to associations surviving FDR correction
urt$Results$PValueFDR <- ApplyFDRCorrection(urt$Results$PValue)
PlotForestFromTable(urt$Results[urt$Results$PValueFDR < 0.05, ])
# Filtered to associations surviving FDR correction
urt$Results$PValueFDR <- ApplyFDRCorrection(urt$Results$PValue)
PlotForestFromTable(urt$Results[urt$Results$PValueFDR < 0.05, ])
 # Standardized estimates
urt_Std <- MakeUnivariateRegressionTable(
data = Labelled,
outcome_vars = c("AXL", "tau", "p_tau", "Ferritin"),
predictor_vars = c("age", "sex", "Adiponectin", "Cortisol", "Insulin"),
Standardize = TRUE
)
PlotForestFromTable(urt_Std)
# Standardized estimates
urt_Std <- MakeUnivariateRegressionTable(
data = Labelled,
outcome_vars = c("AXL", "tau", "p_tau", "Ferritin"),
predictor_vars = c("age", "sex", "Adiponectin", "Cortisol", "Insulin"),
Standardize = TRUE
)
PlotForestFromTable(urt_Std)
 # A binary outcome: odds ratios
urt_Logistic <- MakeUnivariateRegressionTable(
data = Labelled,
outcome_vars = "Diagnosis",
predictor_vars = c("age", "sex", "AXL", "tau", "p_tau")
)
PlotForestFromTable(urt_Logistic)
# A binary outcome: odds ratios
urt_Logistic <- MakeUnivariateRegressionTable(
data = Labelled,
outcome_vars = "Diagnosis",
predictor_vars = c("age", "sex", "AXL", "tau", "p_tau")
)
PlotForestFromTable(urt_Logistic)
 # }
# }